Add a New Machine
Add your Machine
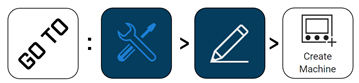
To add a new machine, navigate to the Configuration page.
Select the Edit menu.
Select Create a Machine.
Note
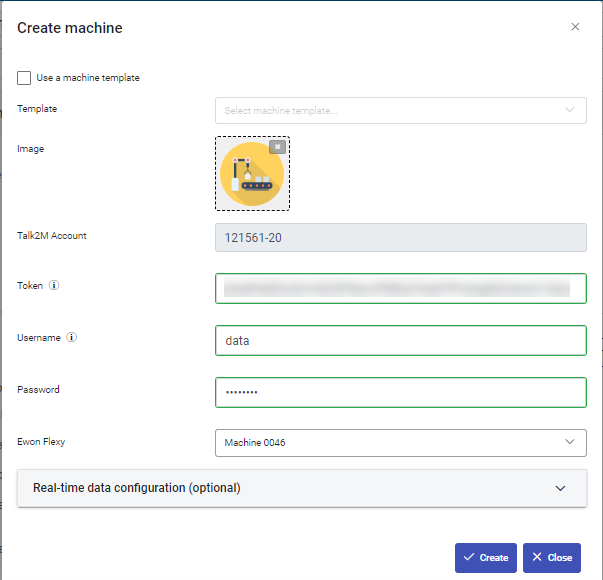
If you are using an existing template, check the Use a machine template checkbox and select your template from the dropdown menu.
Select an image for your machine. If you don't see an image you want, use the Upload files button to upload the image of your choice.
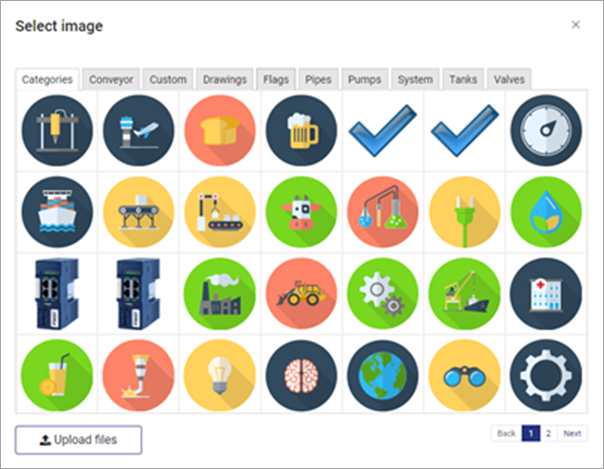
The image you select here will display in when you list your machines.
The Talk2m Account field contains the id for your Talk2m Pro account. You cannot edit this field.
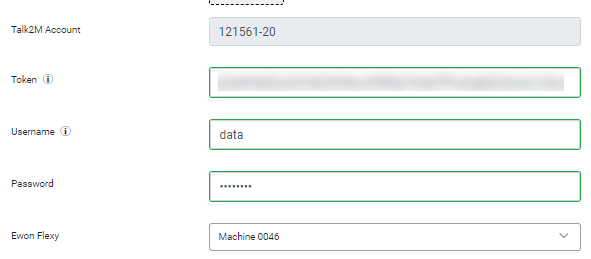
In the Token field, enter a valid API token for your Talk2m account.
In the Username and Password fields, enter valid user credentials for your Talk2m account.
The user associated with these credentials should have limited access rights on the account.
Please refer to the Prepare your Talk2m PRO Account section.
Note
If the credentials are valid, a list of accessible Ewon devices will appear in the dropdown menu of the Ewon Flexy field.
Select the Flexy to link to this machine. The Flexy's name in your Talk2m account will be the name of the machine in the data visualization extension.
If you are using the Real Time Data feature, expand the Real Time Data Configuration menu and enter valid user credentials for your Flexy.
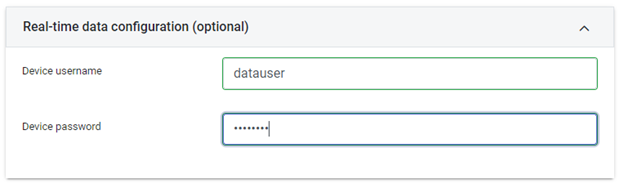
Learn how to create a user in the Prepare Your Ewon Flexy section.
Click the Create button to save your new machine.
Manage your Groups
Groups allow you to organize related machines.
For example, you can create a separate group for each customer or create groups for different machine types.
Groups are important for managing user access rights. You can grant users different roles on different groups.
Someone could be a user on one group but an administrator on another group.
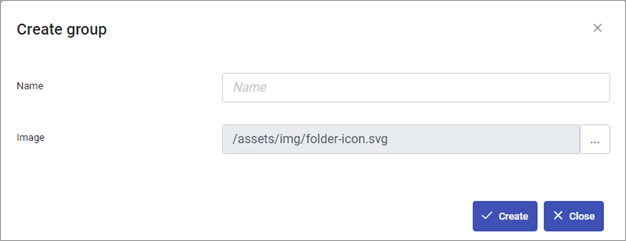
Create a Group:
To create a new group, navigate to the Configuration page.
Select the level where you would like to create your new group. This could be at the root level or within an existing group.
Select the Edit Menu.
Select Create Group.

Assign a Machine to a Group:
To assign an existing machine to or from a group, navigate to the Configuration page.
Select the Machine you want to move.
Select the Edit Menu.
Click on the Move command.

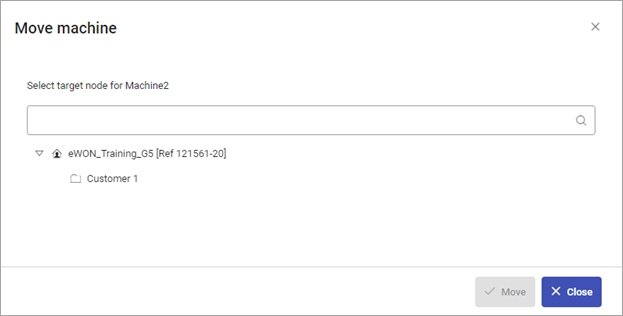
In the Target Node bar, select the Destination of your machine.
Click Move to assign the machine to its group.
Note
This process can also be used to move a group to or from another group.
Delete a Group:
Only empty groups can be deleted. Delete or move any machines from the group before proceeding.
To delete a group, navigate to the Configuration page.
Select the group you want to delete.
Select the Edit menu.
Click on the Delete Group command.

Confirm your choice to delete the group
Manage Your Dashboards
Dashboards let you visualize the information from your machine.
Dashboards can include one or more Views or pages and each view can include several Widgets.
Create a Dashboard:
Note
When you first create a machine, a default dashboard is created for the machine.
You can also add role specific to dashboard . If you create a specific dashboard role, users with that role can only see that dashboards.
To add a role specific dashboard, navigate to the Configuration menu.
Expand your Machine or Template menu to find your Dashboard.
Select the Edit menu.
Click on the Create Dashboard command to add a new dashboard.

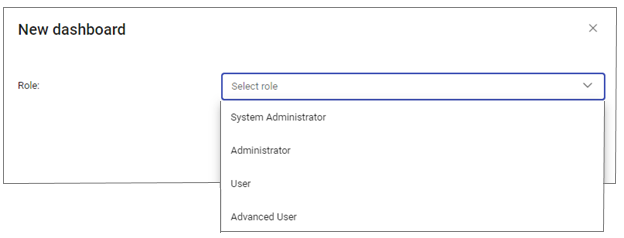
Select the Role associated with this dashboard.
Click Create to save the dashboard.
Edit a Dashboard:
To edit a dashboard, navigate to the Configuration menu
Expand your Machine or Template menu to find your Dachboard.
Click on Edit.

The tags available for use in this dashboard will appear in the Data panel, use the Add Tag icon to add additional tags to the dashboard.
Note
New dashboards are pre-populated with several widgets.
To remove a widget , click on the X in the upper right corner of the widget
To add a widget, simply drag it from the Edit panel onto your dashboard.
To configure your widgets, click on the Settings icon.
DASHBOARD WIDGETS:
Alarm Events:
Use Event Filters to restrict which alarms and events appear on this dashboard.
Check the Allow Manual Creation box if you want Advanced Users and Administrators to be allowed to manually add events.
Leave it unchecked if all events should be generated automatically based on tag values.
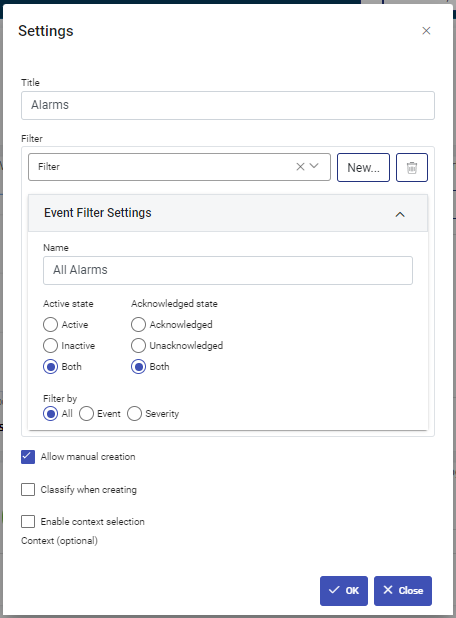
Notice
If Allow Manual Creation is enabled, you must have at least one event filter configured.
Image:
The Image Widget is a static image that appears on the dashboard.
By default the image is the one associated with the machine or template, but different images can be used.
KPIs:
The KPIs Widget shows the most recent values of important tags from your Machine.
On the KPI Settings window, you can add, copy, or delete KPIs.
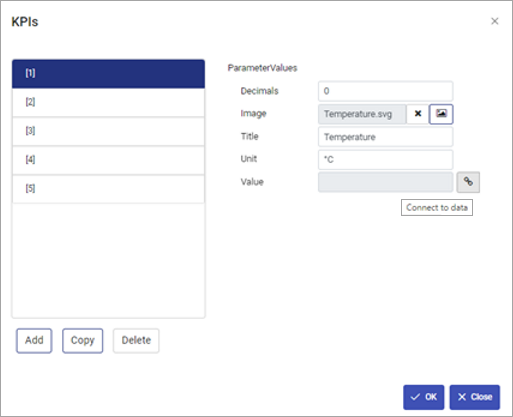
Click on a KPI element to configure it.
Hover next to a field such as the value field to display the icon to connect that field to data.
Note
You can connect it to a tag value, a calculation on tag values, or an event property such as alarm counts.
Monitoring:
The Monitoring Widget lets you see how the value of your tags are changing over time.
You can configure the monitoring widget by dragging tags from the data list to the widget or by using the settings screen.
Reports:
The option to print a report for this Machine can be included in a Dashboard.
This widget is only available if you have a report template already configured.
Service Log:
The Service Log table shows users manually entered events that occurred during the date and time range selected.
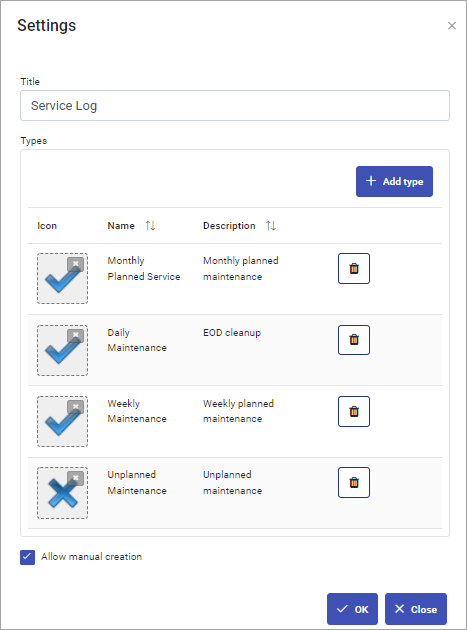
Use the Settings window to define different Service Types.
Enter a name and description for each service type. The icon is optional.
Check the Allow Manual Creation box if you want Advanced users and Administrators to be allowed to manually add events.
Notice
If Allow Manual Creation is enabled, you must have at least one service type configured.