Templates
Create a Machine Template
If most of your machines use the same tags and measurements, creating machine templates can make adding new machines easier.
Create a template:
The easiest way to create a machine template is to create a template from an existing machine.
Navigate to the Configuration page.
Select the Machine you will use to create your Template.
Select the Edit Menu.
Select Convert to Template.

Confirm your selection.
Edit a template:
Navigate to the Configuration page.
Select the template to edit from the Templates list.
Select the Edit Menu.

Use the Update Machine Template command to make changes to the name or image associated with the template.
Use the Add Alarm or Delete Selected Alarms command to adjust the alarms for this template.
Note
The Add Dashboard command allows you to add additional dashboards to the template.
To delete a dashboard from the template, select the dashboard and use the Remove Role Dashboard command from the edit menu. The Default dashboard cannot be deleted.
Note
The Report Template command lets you add a report template to the machine template.
To delete a report template from the machine template, select the report template and use the Remove Report Template command from the edit menu.
Delete a template:
Navigate to the Configuration page.
Select the template to delete from the Templates list.
Select the Edit Menu.
Select the Delete Machine Template command.
Confirm your choice.
Create a Report Templates
Report templates let you create static reports that your users can print or export as PDF files.
Creating a Report Template:
To create a Report Template, navigate to the Configuration page.
Select the Machine or Template for this report.
Select the Edit Menu.
Select Create Report Template.

Use the Controls options to add elements to your report such as shapes, text elements, graphs and data tables.
Then use the fields in the Properties section to configure those elements.
Note
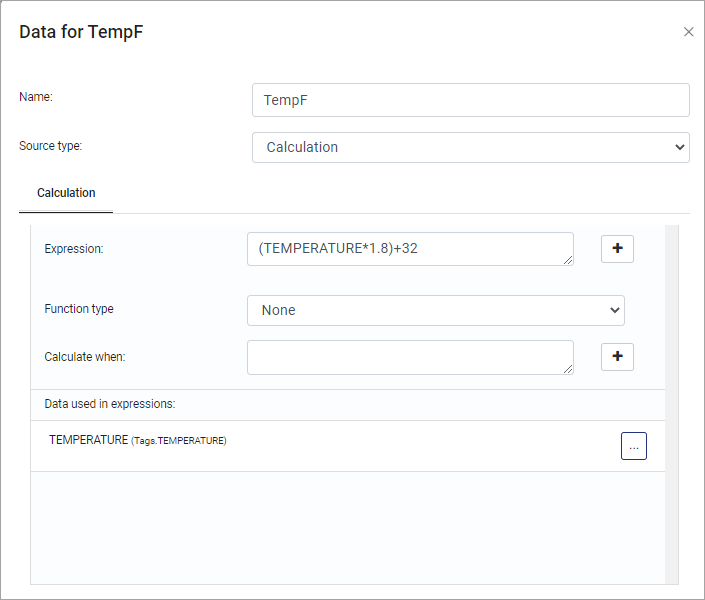
You can connect these element to different data elements too such as tag values, calculations based on tag values, or report properties.
If you need to add additional pages to your report, click the New Section button to add a new page.
Notice
To make your report available to your users, be sure your dashboard includes the PDF widget.
By adding the widget, your users will be able to print the report.
EXAMPLES:
Link a Text Element to a Dynamic Value:
Select the Text item from the Controls panel.
Click on the Report in the location where the item should be added.
While holding the mouse button down, drag the cursor to determine the size of the text element.
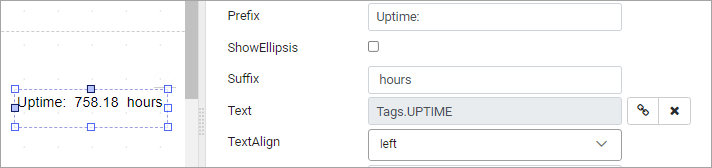
Use the Properties panel to adjust the appearance of the text element including its font size and any text that should precede or follow the tag value.
Hover the mouse next to the text field to display the icon to connect that field to data.
Example: You can link the text element to the value of a tag.
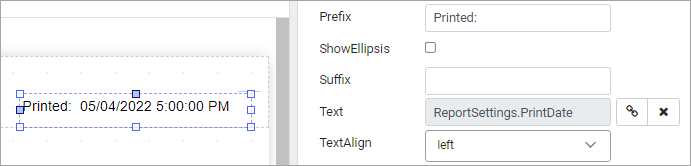
Example: You can link the text element to one of the report settings.
Add a Chart:
Select the Chart item from the Controls panel.
Click on the Report in the location where the item should be added.
While holding the mouse button down, drag the cursor to determine the size of the chart.
Hover over the chart and select the Edit Series option or edit the series from the Properties panel.
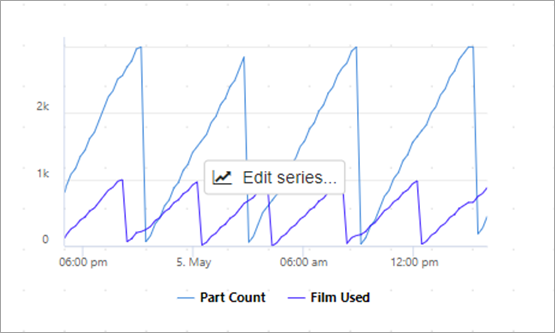
Use the Add button to add a trend to the chart.
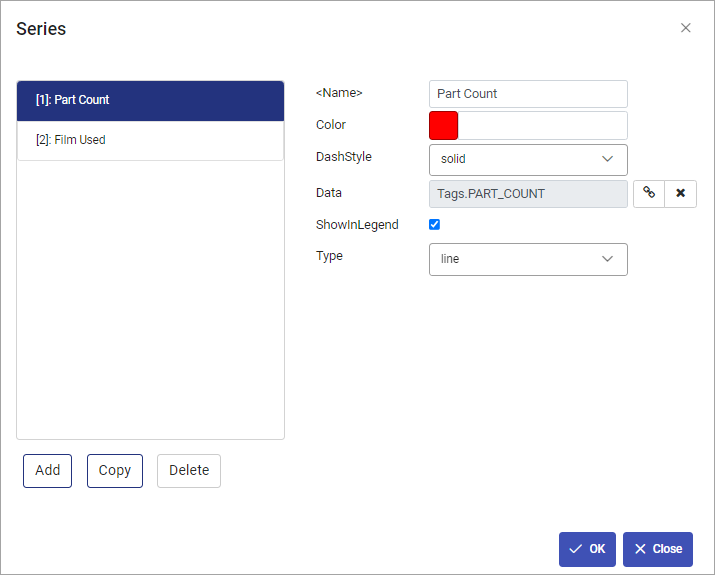
Hover the mouse next to the Data field to display the icon to connect the series to data.
Add a Table:
Select the Values Table item from the Controls panel.
Click on the Report in the location where the item should be added.
While holding the mouse button down, drag the cursor to determine the size of the table.
By default, the rows will be the unique timestamps. You can select which values will be displayed in each column.
Examples: Columns can display the tag values
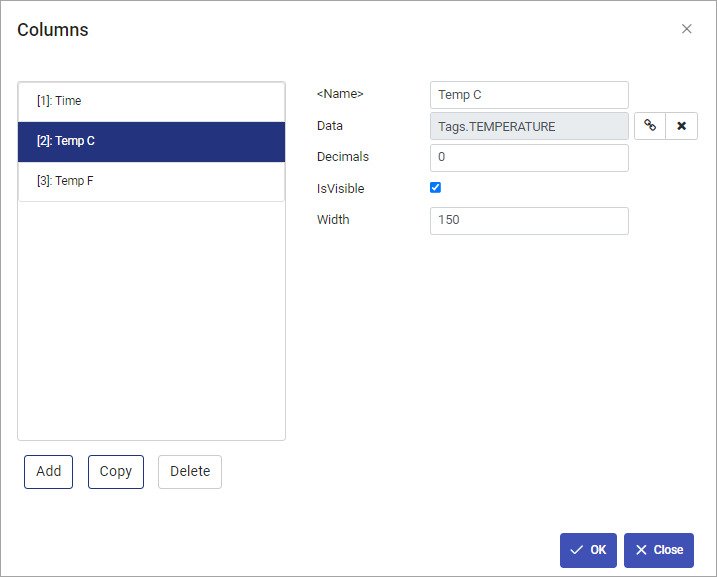
Examples: Columns can also display calculations or expressions based on tags