Diagnostic
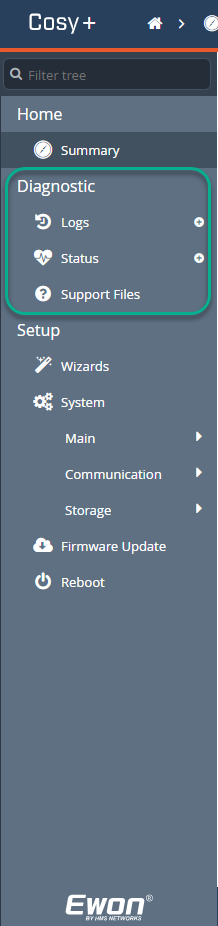
The Diagnostic menu records significant system events on the that can be used in case of troubleshooting.
An event is given one of three severity levels: Error, Warning or Trace and color coded correspondingly.
Logs
Event Logs
The Event logs contain historical records of system messages, warnings, and errors that have occurred on your Ewon device. These messages can be useful for troubleshooting issues.
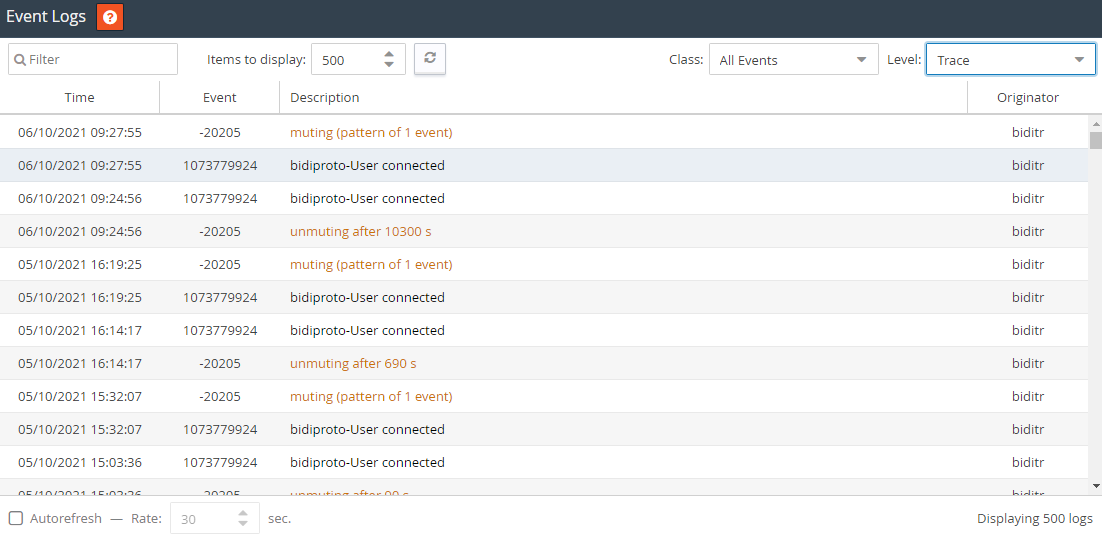
By default, events are presented in reverse chronological order: recent events on the top, older ones at the bottom. You can sort on any field to present them in a different arrangement.
The events are displayed in different colors to differentiate: Error (red), Warning (orange) and Trace (black) events.
The contents of the Event log can be retrieved from the Events.txt file from the Ewon device’s FTP server (or the File transfer page).
Diplay Filters:
You can use the fields at the top of the screen to control which events are displayed.
Items to display | Limit the number of items to show. |
Class | Filter the events based on their nature or category such as events associated with initialization or certain types of communication. |
Level | Filter the events based on their severity. The selected level any higher levels are show. |
Display Fields:
Each entry in the event log includes the following fields:
Time | The time and date when the event occurred. |
Event | The unique ID for the event. |
Description | A description of the event. Each description refers to a single event ID. |
Originator | The interface or process that triggered the event. |
There is a dedicated web page with a list of most common error events / troubleshooting suggestions on the Ewon website.
Real Time Logs
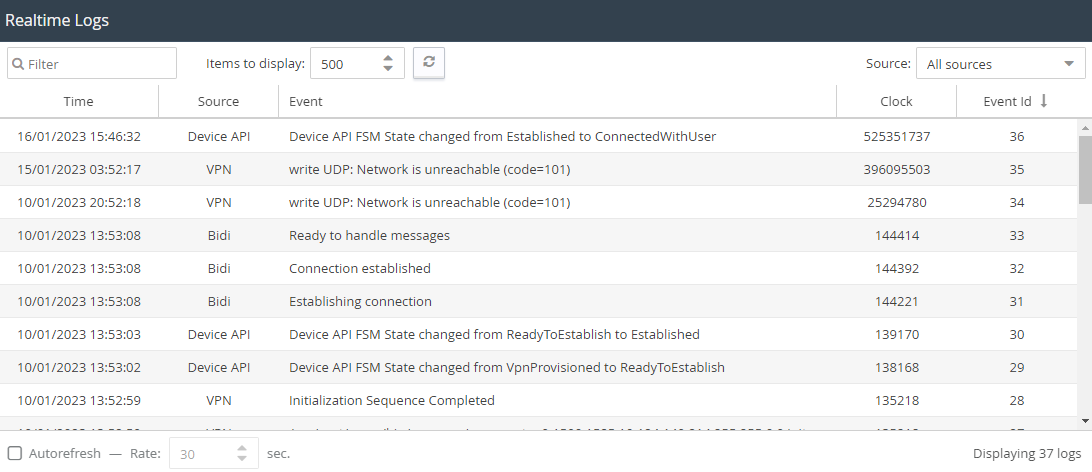
The Realtime log displays debugging information for different interfaces. These logs are stored in RAM memory and are cleared on reboot.
Notice
This logging is a time consuming task and can slow down the overall behavior of your Ewon device. While some logging is enabled by default, activating additional debugging interfaces should only be done at the request of your support contact and only during the debugging process.
Information about enabling debugging or modifying debugging levels can be found:
For VPN
For WiFi
For Modem
For Serial communications
Display Filters:
You can use the fields at the top of the screen to control which entries are displayed.
Filter | Free text filter. All five columns are taken into consideration. |
Items to display | Limit the number of items to show. |
Source | Filter the events based on their interface. |
Display Fields:
Each entry in the log includes the following fields:
Time | The time and date when the event occurred. |
Source | The interface or process that triggered the event. |
Event | The unique ID for the event. |
Clock | The time in msec since the Ewon device has booted. |
Event ID | A unique index for this event. These are reset at reboot. |
Status
System Counters
Memory Information:
This page displays internal variables and counters representing the current live status of your Ewon device.
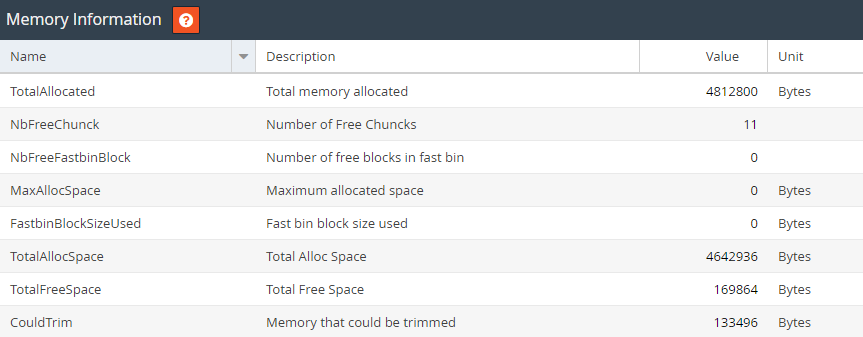
In general, it is normal to see these values change over time. However, if you see entries related to errors increasing, check the Events Log for more information about problems that may be occurring.
NAT & IP Forwarding:
This page displays internal variables and counters representing the current live status of your Ewon device.
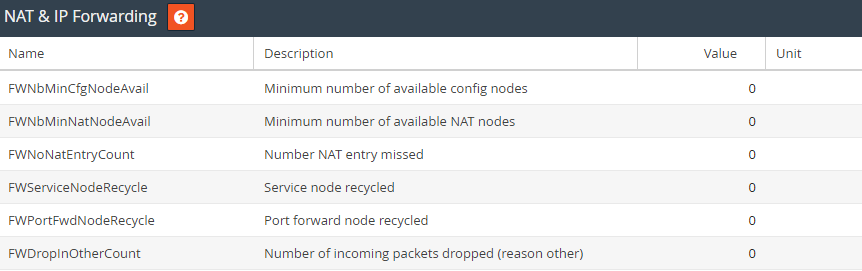
In general, it is normal to see these values change over time. However, if you see entries related to errors increasing, check the Events Log for more information about problems that may be occurring.
System Information
General:
This page displays internal variables and counters representing the current live status of your Ewon device.
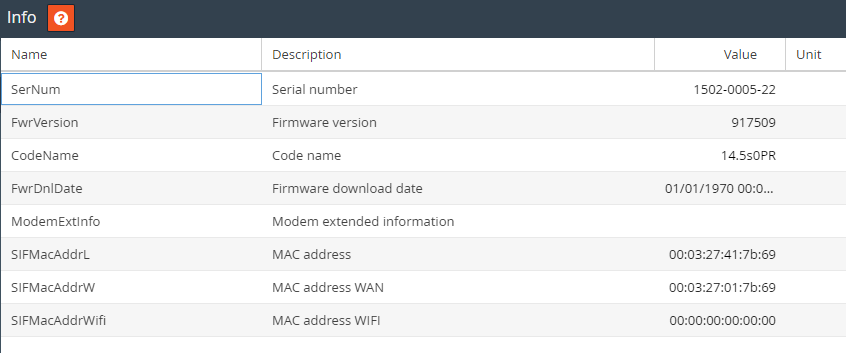
In general, it is normal to see these values change over time. However, if you see entries related to errors increasing, check the Events Log for more information about problems that may be occurring.
Status:
This page displays internal variables and counters representing the current live status of your Ewon device.

In general, it is normal to see these values change over time. However, if you see entries related to errors increasing, check the Events Log for more information about problems that may be occurring.
System:
This page displays internal variables and counters representing the current live status of your Ewon device.
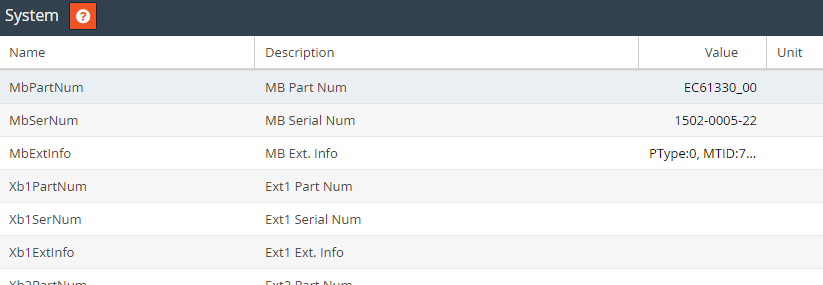
In general, it is normal to see these values change over time. However, if you see entries related to errors increasing, check the Events Log for more information about problems that may be occurring.
Support Files
The Support Files are a back-up of your Ewon device that you can download from the Web Configuration Interface of your Ewon.
These files are issues in .etar.gz extension
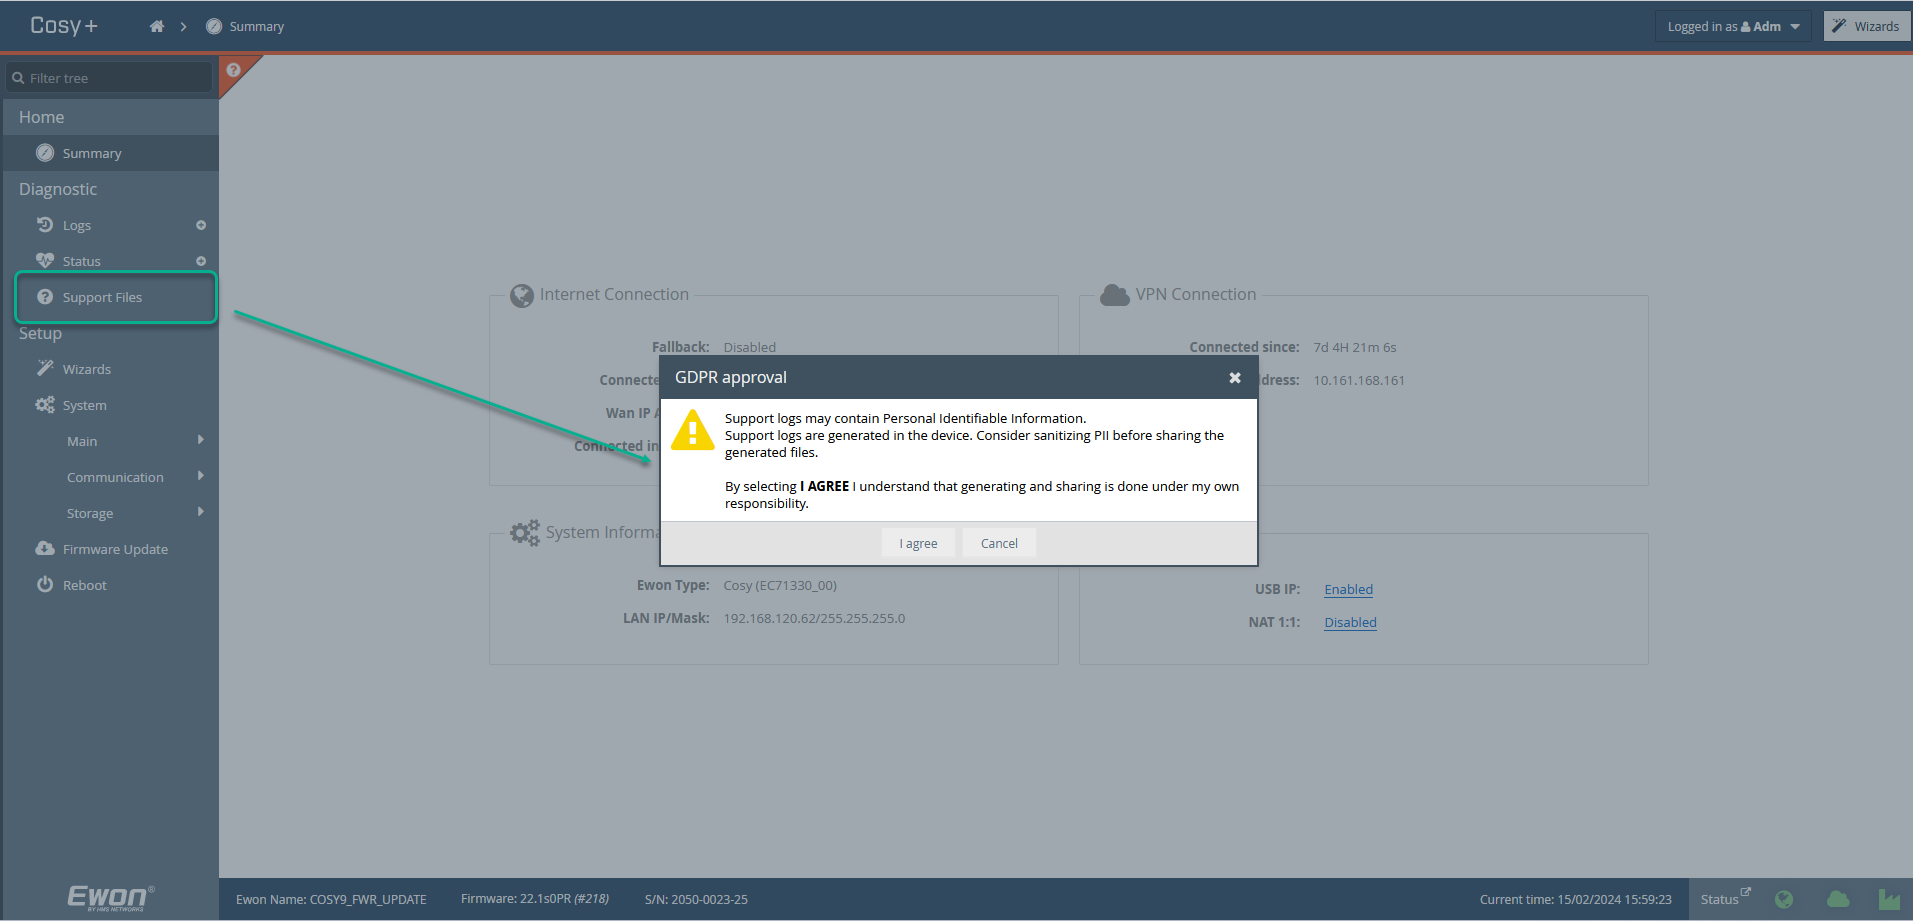
To get this back-up:
Connect to the device through the Web Configuration Interface of your device.
On the left menu, under Diagnostic, click on Support Files.
You will be prompted to a GDPR approval pop-up that you must agree with.
Your back-up files are sent for download in the folder you choose earlier.