i4designer Alarms management tutorials
Check out this article and learn more details about the i4designer Alarms components, available for your i4scada platform projects.
The present article describes the management of the Alarming components. This article is split up into two main sections:
Designing the Alarms Management project
Managing Alarms at run-time
Note
The Alarms Management tutorials use the i4scada Demo Database of Studio project and the Alarms / Alarm Groups associated with it.
Designing the Alarms Management project
Check out this article and learn how to design your alarms management project, using the Alarms viewer and the Alarms state manager components.
This tutorial will guide you through the steps needed to design a simple Alarms Management project, using the i4designer platform.
Tip
For more details about the design-time properties of the Alarm Viewer, the Alarm State Manager, and the Logbook components please visit the dedicated articles.
Since our goal is to design a basic project, we shall only use four i4designer components, as follows:
Open your project in Designer and go to the Toolbox panel, in the contextual actions area.
Warning
The Alarm components are available only for i4designer projects, created for the i4scada platform.
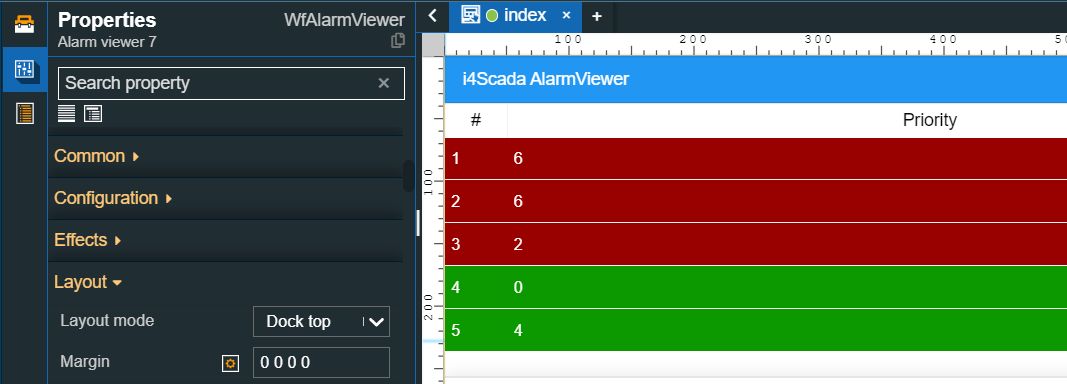
Drag the Alarm Viewer component on the drawing surface of the page and double click it, to open the Properties panel. Next, proceed with the following settings:
Using the drop-down list, of the Layout mode property, under the Layout category, select the Dock top option. This will pin the component to the top-left side of the project page, automatically adjusting its size to the page width.
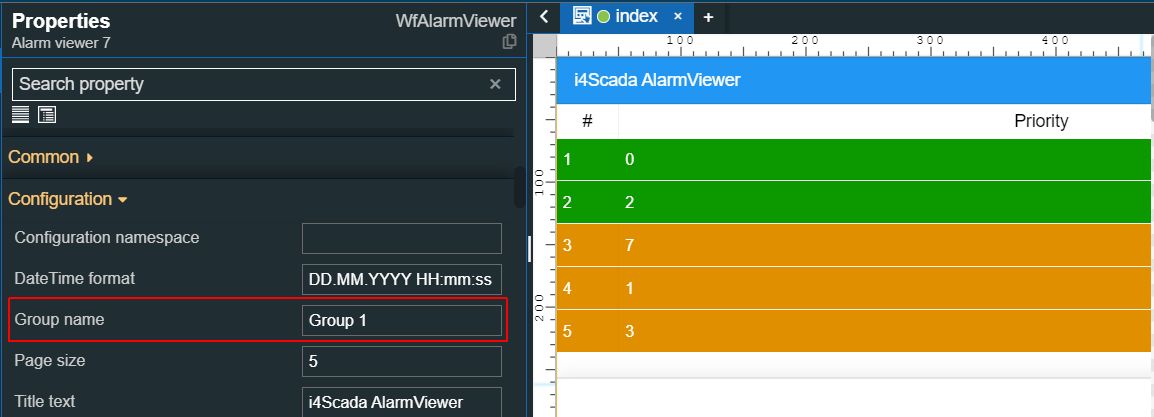
Set the name of the targeted i4scada Signal group, by filling in the value of the Group name property.
Tip
The Configuration properties allow you to customize the DateTime format and the Title text of the component.
Enable the Online mode property with an Update rate of 2000 milliseconds, under the Alarms category.
Tip
When the Online option is set, the current alarms will be retrieved cyclically, using the Update rate value as one polling cycle.
Further changes at the level of the component's Security, Alarm sounds, Time range, Appearance, Style, Typography, and Effects can be organized. For this tutorial, we shall leave the default options.
Next, let's add the Alarm State Manager component to the project page. For this tutorial, we shall leave the default configuration properties of the component, but you can customize its Security, Layout, Effects, Appearance, and predefined Alarm Tag filters.
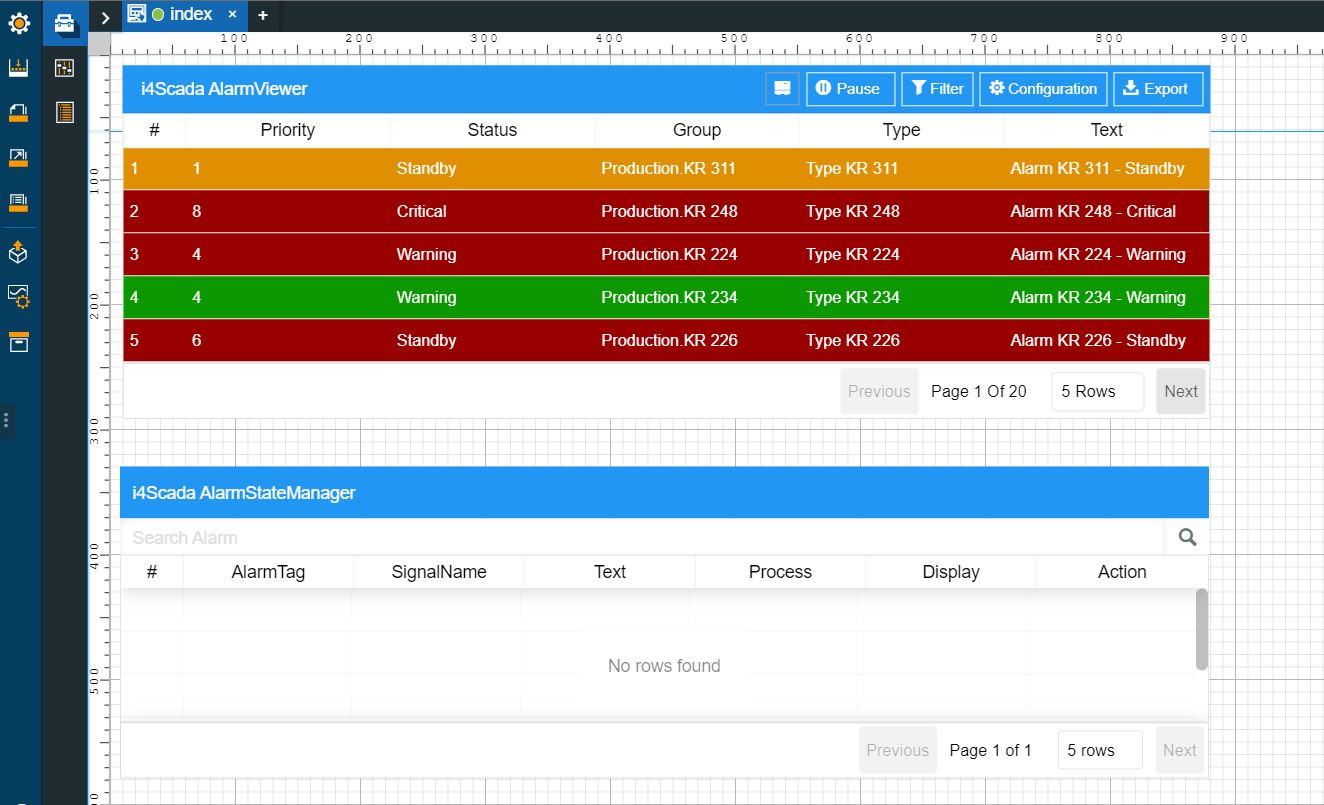
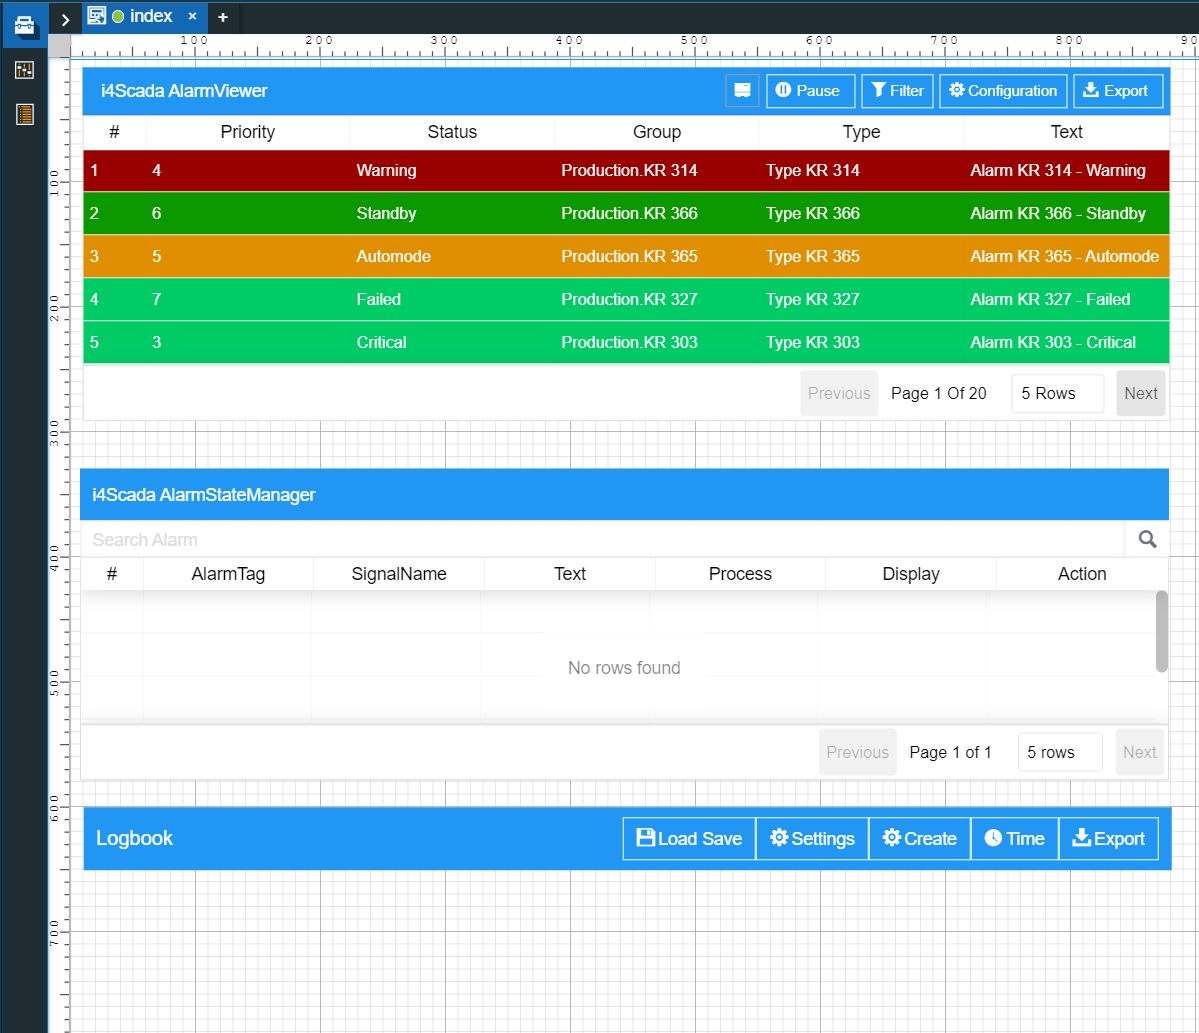
Add the Logbook component to the project page, leaving the default configuration. If desired, you can customize the component's Security, Layout, Effects, Appearance, and predefined logbook topics.
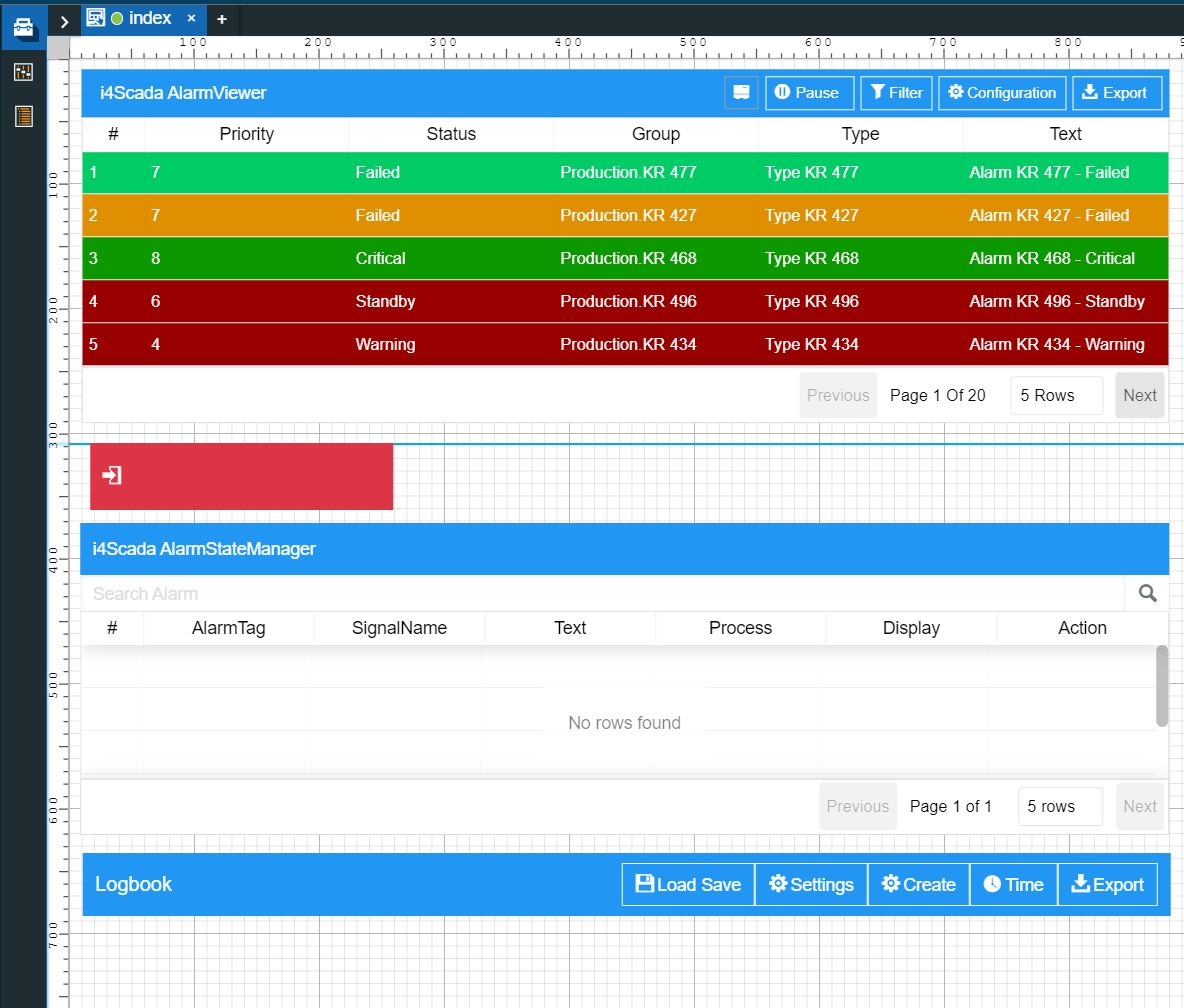
Last but not least, drag the User Login component, to the project page. The Properties of the User Login component can also be left with their default values, if no further changes at the level of Security, Layout, Effects, Style, Appearance, and Configuration are not needed.
Warning
Since the Alarm State Manager component has an integrated security feature, only the logged-in users having the appropriate set of permissions will be allowed to actually interact with the Alarm States.
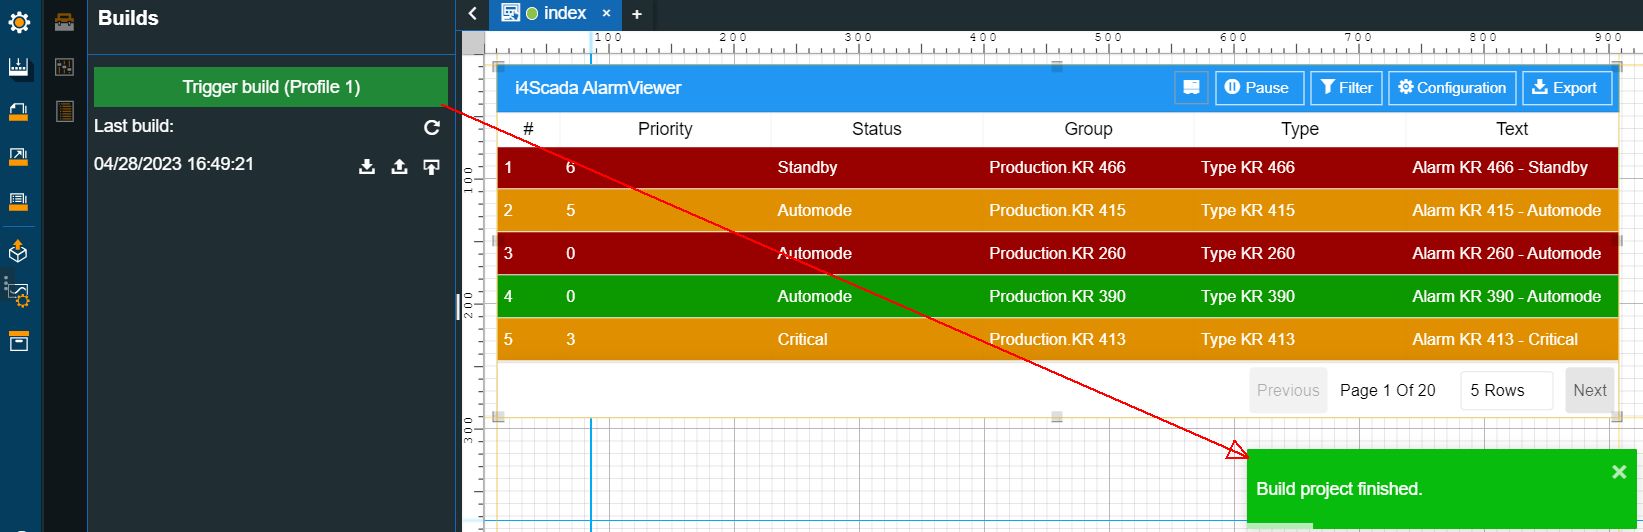
Make sure that all the processed settings are saved and go to the Builds menu, in the global actions area of the Designer application.
Build your project.
Tip
For more details about i4designer project builds, please visit the dedicated articles here.
Next, proceed with publishing the project to the target environment.
Tip
For more details about i4scada platform deployments, please visit the dedicated article here.
Managing Alarms at run-time
Check out this article and learn more details about the alarms management, at run-time, when using an Alarming project.
After publishing your HTML Alarms Management project, here is how you can use the run-time components, to manage your alarms.
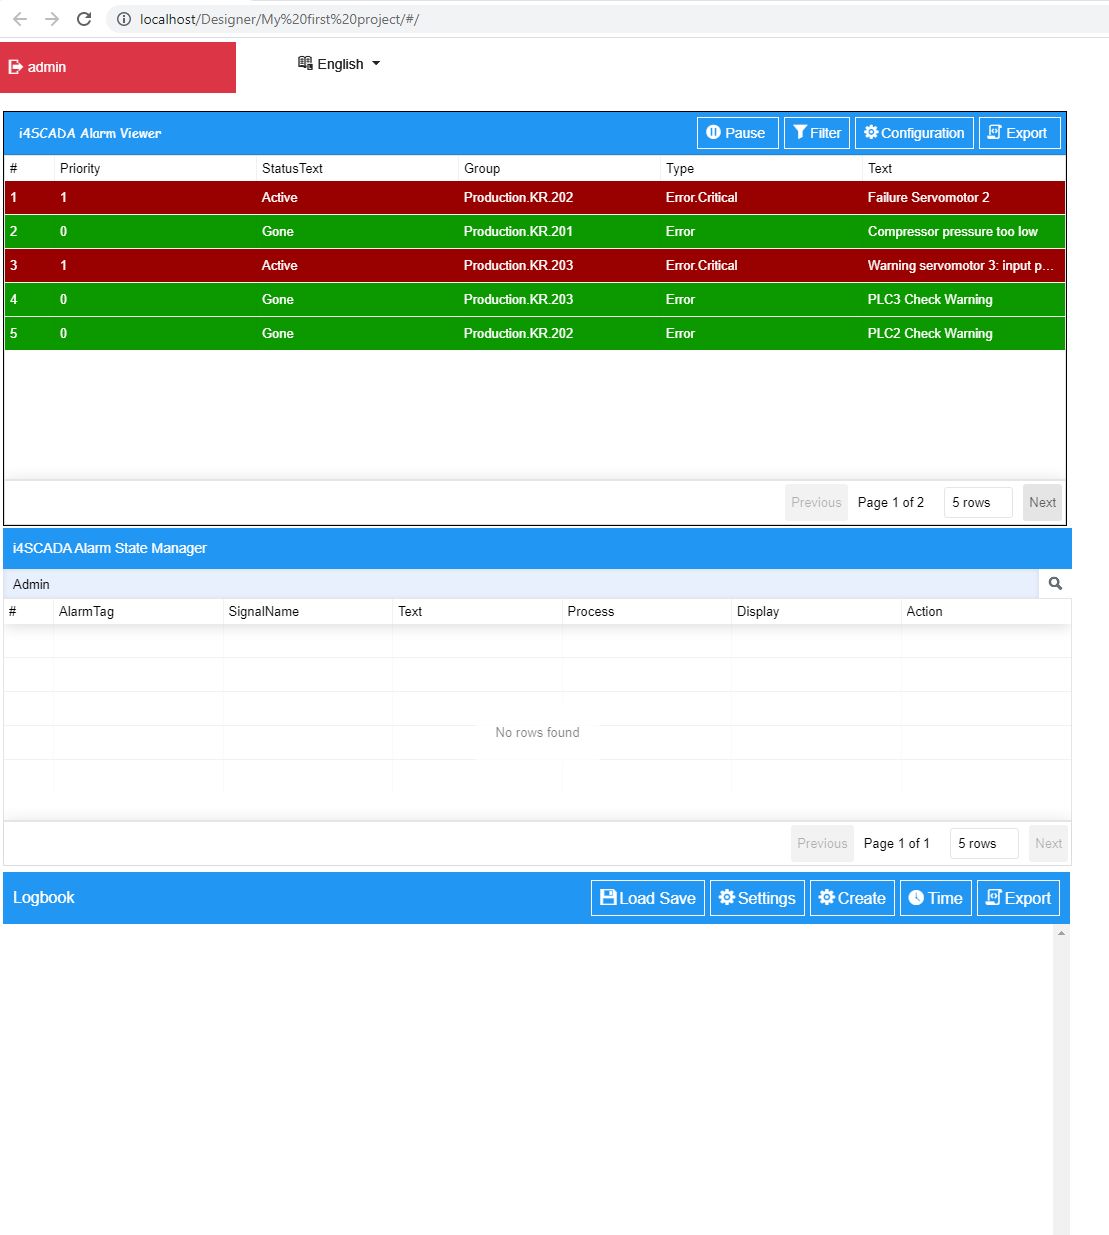
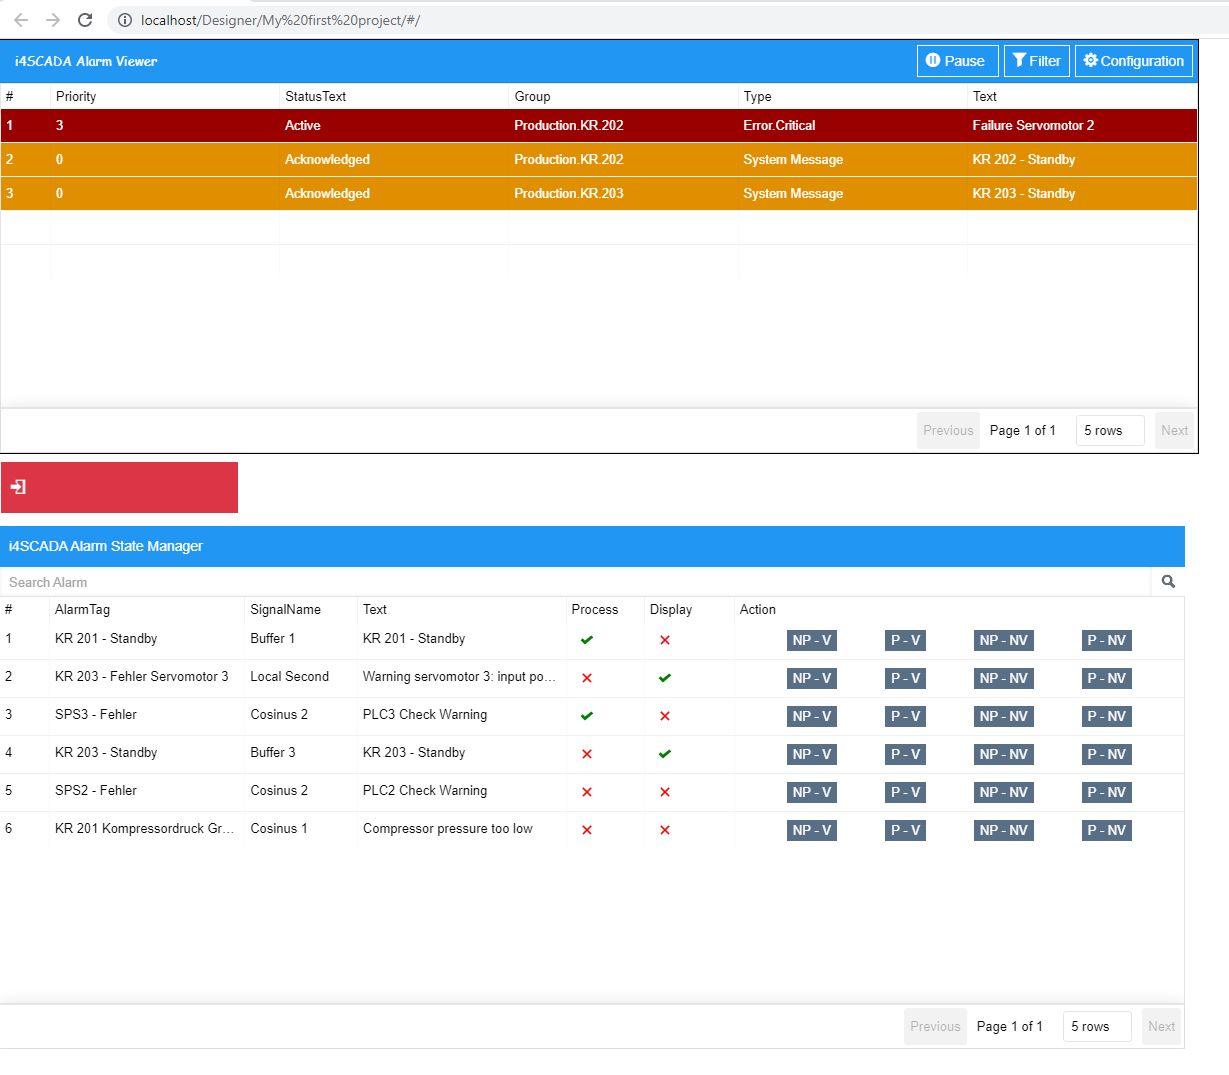
Access your i4scada environment and open the visualization. The Alarm Viewer, Alarm State Manager, and Logbook components are visible on the page.
Tip
For more details about i4designer integration with i4scada, please visit the dedicated tutorials, here.
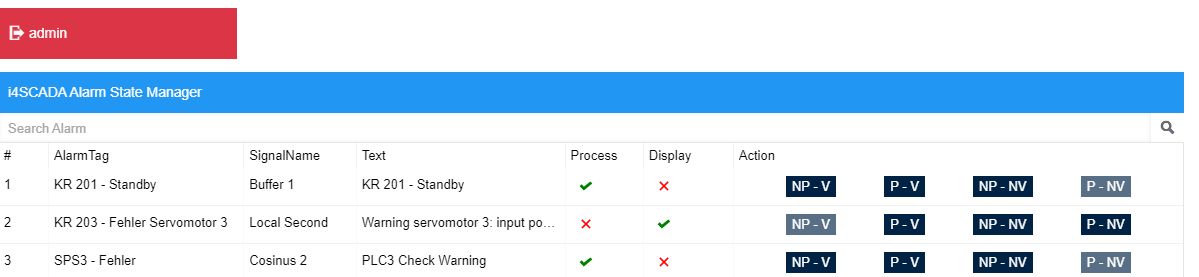
The Alarm State Manager will display no data until you are logged in. Therefore, click on the Login button and fill in your user's credentials.
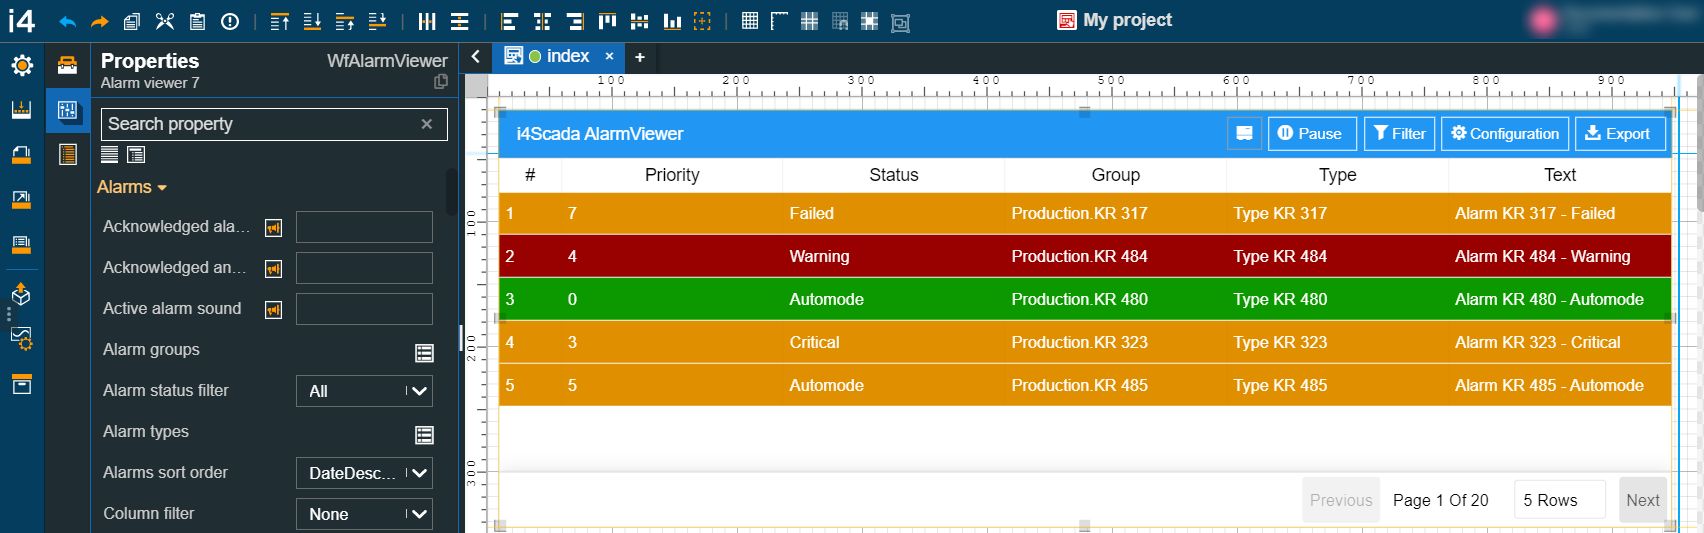
Next, let's manipulate the project, by using the Alarm Viewer component action options:
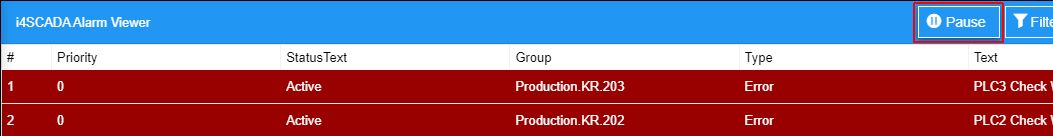
Since for this project, we set the Online mode property to True, at design-time, the toolbar of the Alarm Viewer component allows us to temporarily stop the alarms flow, by clicking the Pause button.
Note
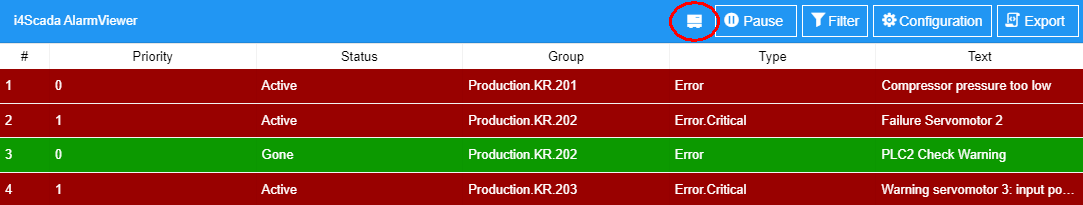
The toolbar of the Alarm Viewer component shows a status indicator. Between updates, the icon shows the status “Idle” and when new updates are received, the icon changes its appearance and shows the status “Refreshing".
Clicking the Filter toolbar button opens the Edit filter window, exposing the following filtering options:
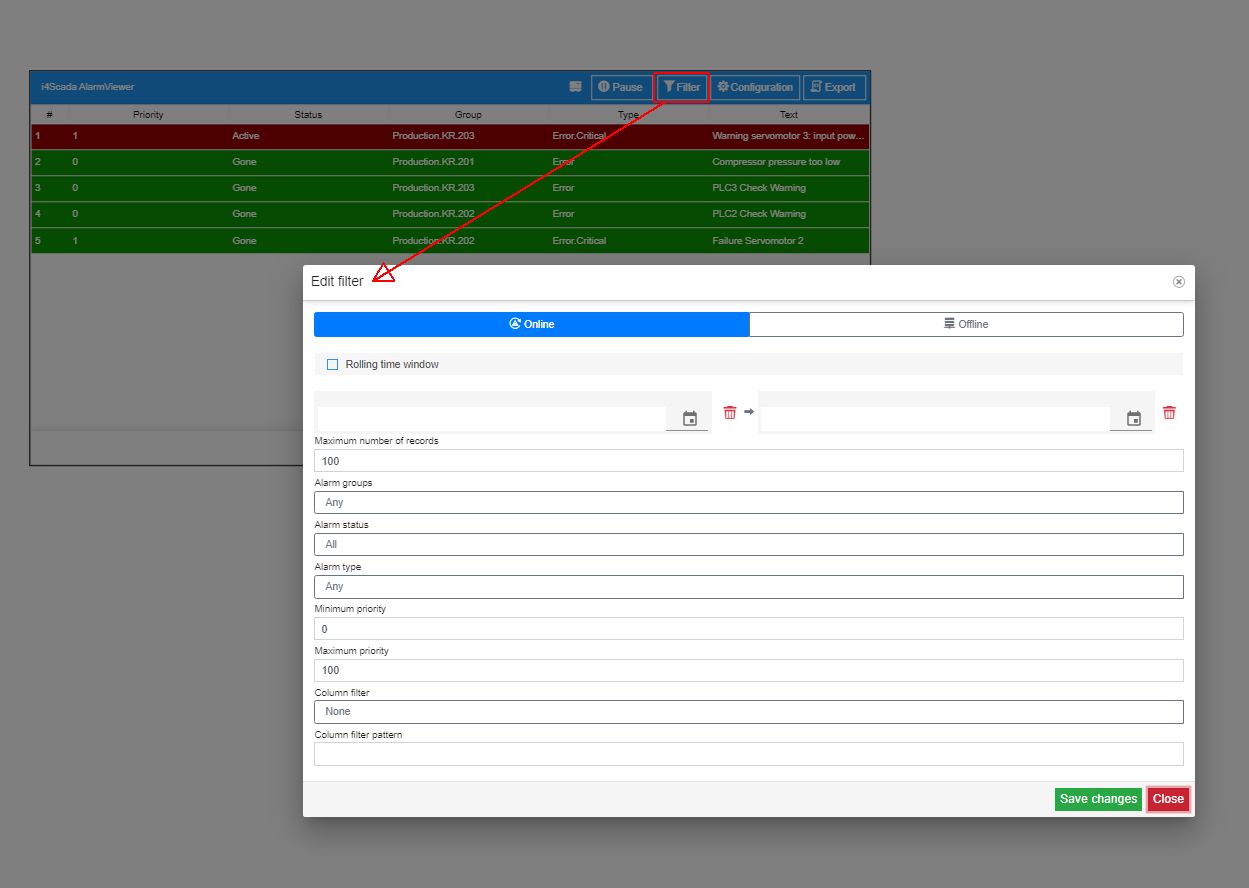
possibility to switch between Online and Offline (historical) alarms. By default, the Alarms viewer lists all the Online alarms.
Note
Due to the fact that loading and management of large amounts of Offline Alarms is a resource and time consuming task, a network adaptive mechanism that loads the alarms in batches has been introduced. However, we highly recommend the users apply sharply defined filters and set the "Maximum number of records" to a maximum value of 100.000 records
possibility to enable/disable the Rolling time window feature, in order to apply the Online or Offline mode repeatedly to the sub-datasets or sub-sets, in the full data set or series.
possibility to set the start and end date and time, using the From/To selectors. The data and time can be selected from the Calendar pop-up dialog.
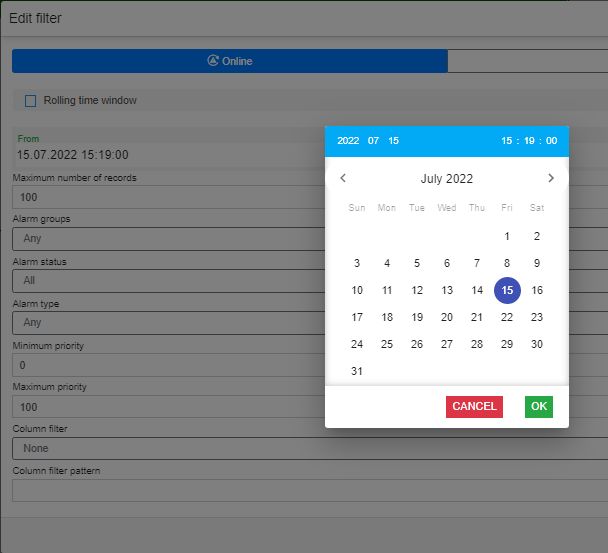
possibility to set the Maximum number of records displayed by the Alarm viewer. By default, the maximum number of records is set to 100 entries.
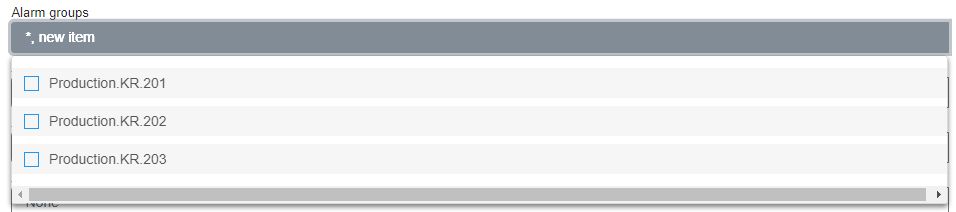
possibility to set the Alarm groups to be displayed by the Alarm Viewer, selecting from the drop-down list options. The list is prepopulated with all the Alarm Groups available for your i4scada project.
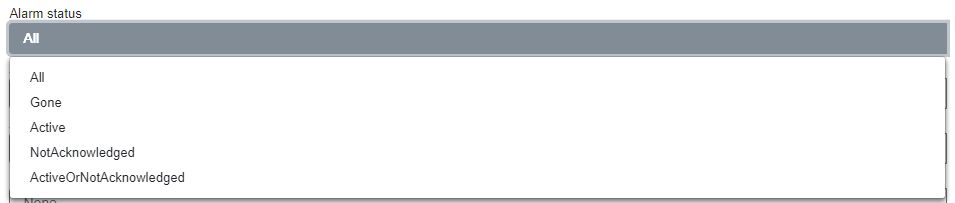
possibility to set the Alarm status to be displayed by the Alarm Viewer, selecting from the drop-down list options. The list is prepopulated with all the Alarm statuses, as follows: Gone, Active, NotAcknowledged, and ActiveOrNotAcknowledged.
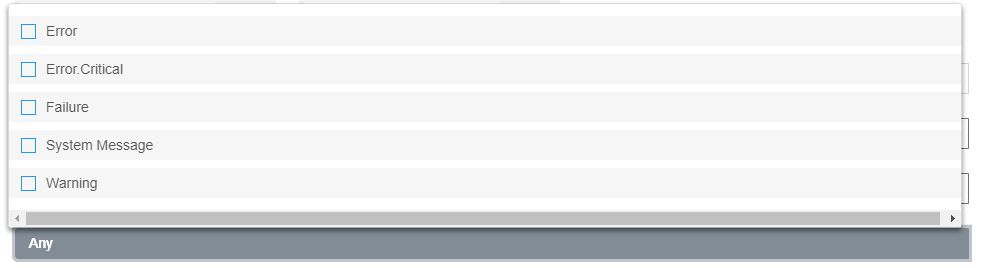
possibility to set the Alarm type to be displayed by the Alarm Viewer, selecting from the drop-down list options. The list is prepopulated with all the Alarm Types available for your i4scada project.
possibility to set the Minimum priority to be displayed by the Alarm Viewer, either by manually typing in the desired value or by using the up and down arrows.

possibility to set the Maximum priority to be displayed by the Alarm viewer, either by manually typing in the desired value or by using the up and down arrows.

possibility to apply a Column filter to the Alarm Viewer, selecting from the drop-down list options. The list is prepopulated with all the Alarm columns, such as Text, SignalName, OpcItem, Name, HttpLink, HelpCause, HelpEffect, HelpRepair, GeneralComment, OccurrenceComment, AcknowledgeComment, NavigationSource, NavigationTarget, ExtendedProperty#.
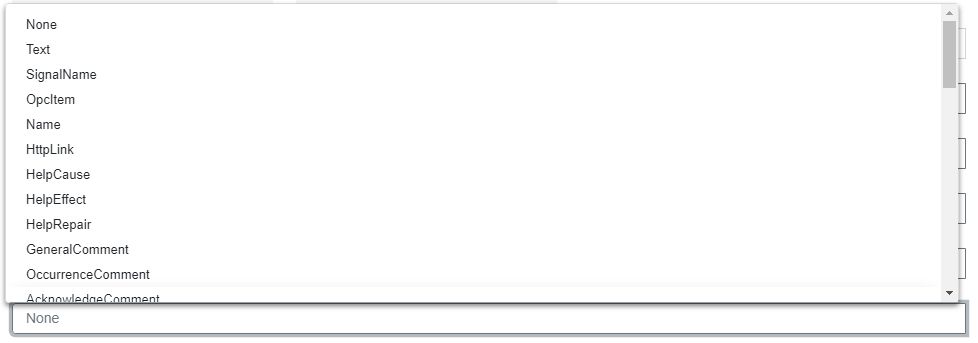
possibility to apply a Column filter pattern to the Alarm Viewer. This field also supports the "*" wildcard, as a placeholder, when defining filter patterns.
To save the current configuration, click the Configuration toolbar button. The Configuration window is opened, displaying the following areas:
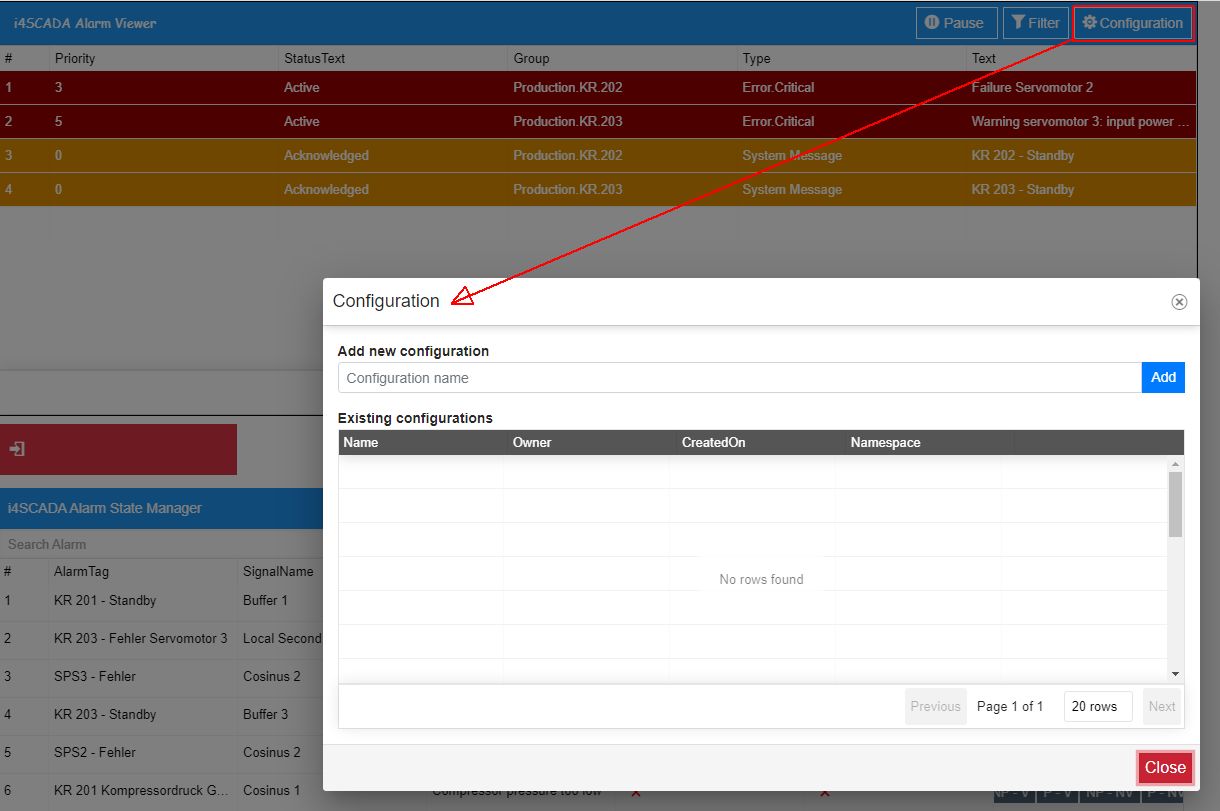
The Add new configuration area features an easy method to define new configurations or to update the existing configurations, by typing in the name of the configuration and clicking the Add / Update button. The user can also Import a configuration saved previously on their local machine.
Tip
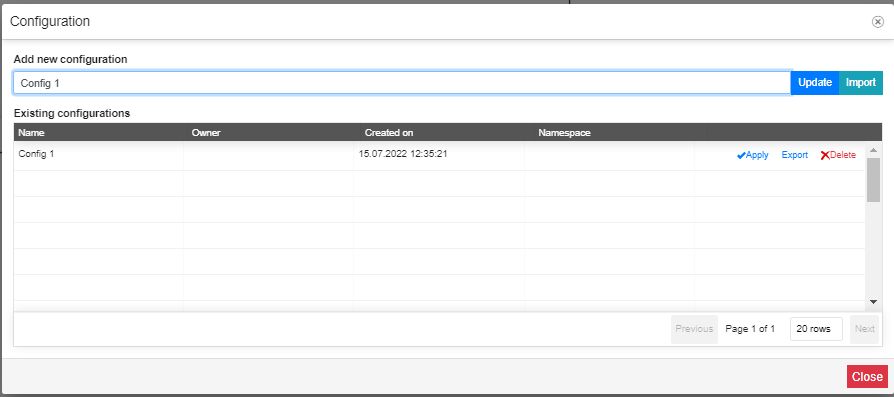
There can not be multiple configurations with the same name, for the same component. In an attempt to add a duplicate configuration, the Add button, displayed in the Add new configuration section, is changed into an Update button.
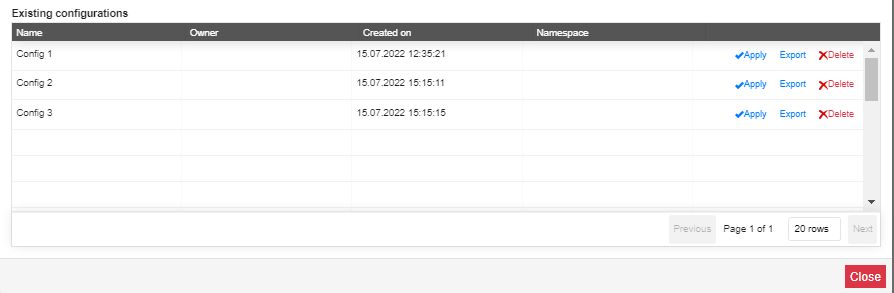
The Existing configurations area lists all the configurations, available for the Alarm viewer. The Existing configurations table features the following columns:
Name - the name of the component configuration, provided by the creator user, at the moment of creation. There cannot be multiple configurations with the same name, in the context of one single component.
Owner - the user that owns the component configuration.
Created On - the creation date.
Namespace - the value of the Namespace property, as defined at design-time.
Actions - the actions available for the selected configuration. The scope of the Actions area is to allow the user to either load, export configurations, or, remove them.
The Apply button applied the selected configuration to the Alarm viewer component. As soon as an existing configuration is applied, the Configurations window is closed and the Alarm viewer is updated according to the configurations.
The Export button allows the export of the configuration, on a local machine.
The Delete button removes the selected configuration.
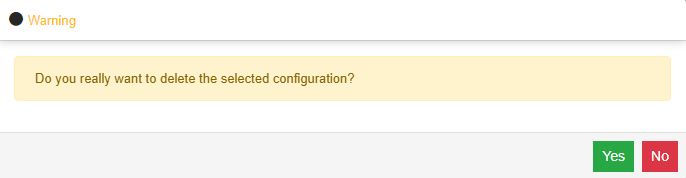
As soon as an existing configuration is selected and the user clicks the Delete button, a confirmation dialog pops up asking for the user's decision (Yes / No buttons).
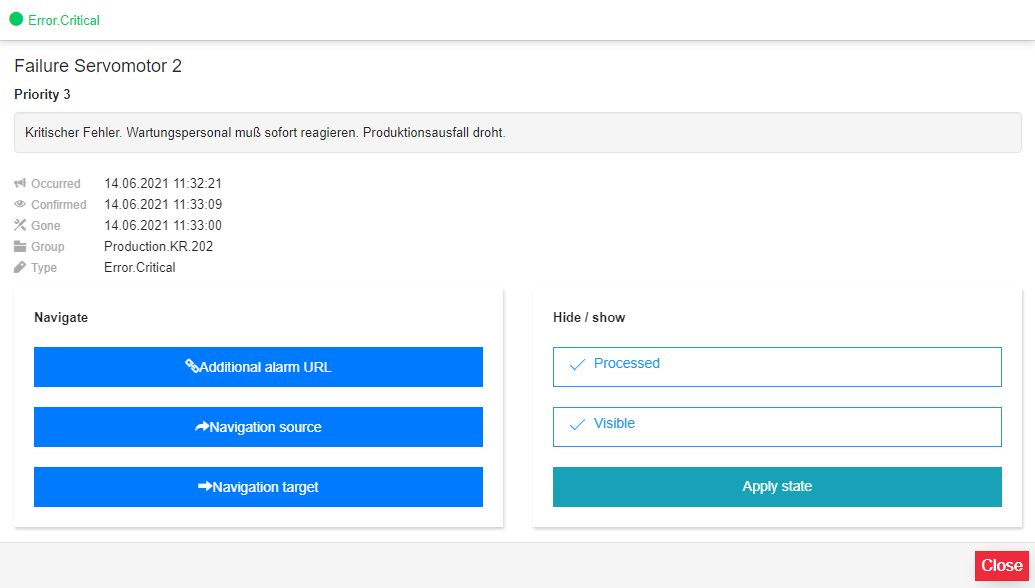
To view and manage alarms, using the Alarms viewer component, click on the listed alarms, to open the alarm in detailed view mode. In this view, a set of alarm details can be seen, such as Alarm name, priority, comment, occurrence date and time, start date and time, group, type, and any information about alarm cause (reason), effect (impact) and repair method (rectification).
Tip
The alarms listed in the Alarm viewer can exhibit different colors, depending on their status. The colors for each status can be defined at design time, using the Palette section of the component's Properties list.
Depending on the alarm's current status, you will be provided with a set of actions, as follows:
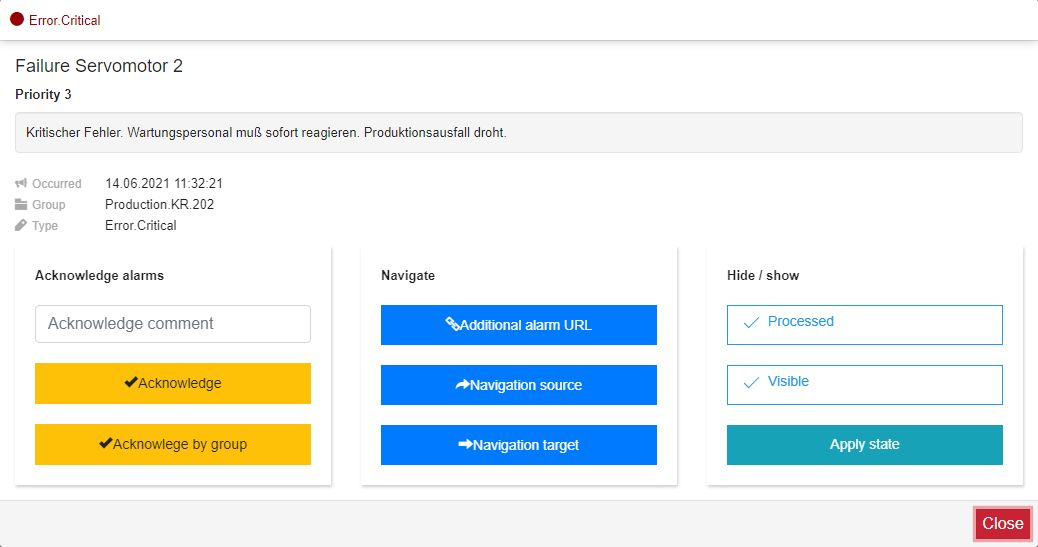
Gone alarms
Acknowledge alarms - in this area, you can fill in a comment and acknowledge/acknowledge by group, the selected alarm. These actions will change the alarm's current status to Acknowledged and Gone.
Navigate - in this area you can navigate to various URLs, such as the Additional alarm URL, the Alarm source, and the Alarm target, assuming that such navigation links are provided for the alarm.
Hide / Show - in this area, you can change the alarm state, by enabling/disabling the Processed and Visible states. After clicking the Apply state button, the selected alarm will be made available in the Alarm State Manager table, as soon as the browser page is refreshed.
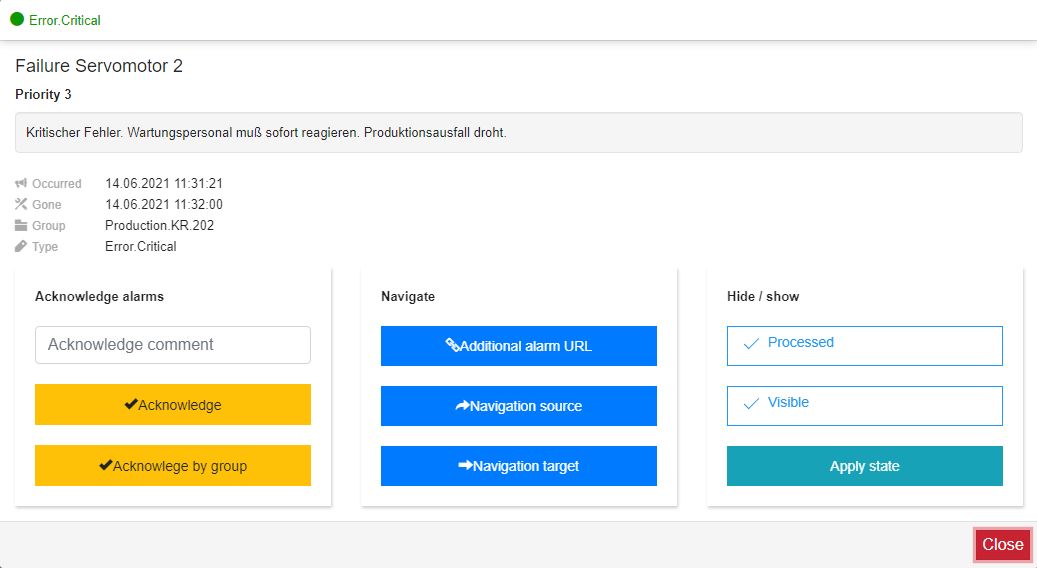
Active alarms
Acknowledge alarms - in this area, you can fill in a comment and acknowledge/acknowledge by group, the selected alarm. These actions will change the alarm's current status to Acknowledged.
Navigate - in this area you can navigate to various URLs, such as the Additional alarm URL, the Alarm source, and the Alarm target, assuming that such navigation links are provided for the alarm.
Hide / Show - in this area, you can change the alarm state, by enabling/disabling the Processed and Visible states. After clicking the Apply state button, the selected alarm will be made available in the Alarm State Manager table, as soon as the browser page is refreshed.
Acknowledged alarms
Hide / Show - in this area, you can change the alarm state, by enabling/disabling the Processed and Visible states. After clicking the Apply state button, the selected alarm will be made available in the Alarm State Manager table, as soon as the browser page is refreshed.
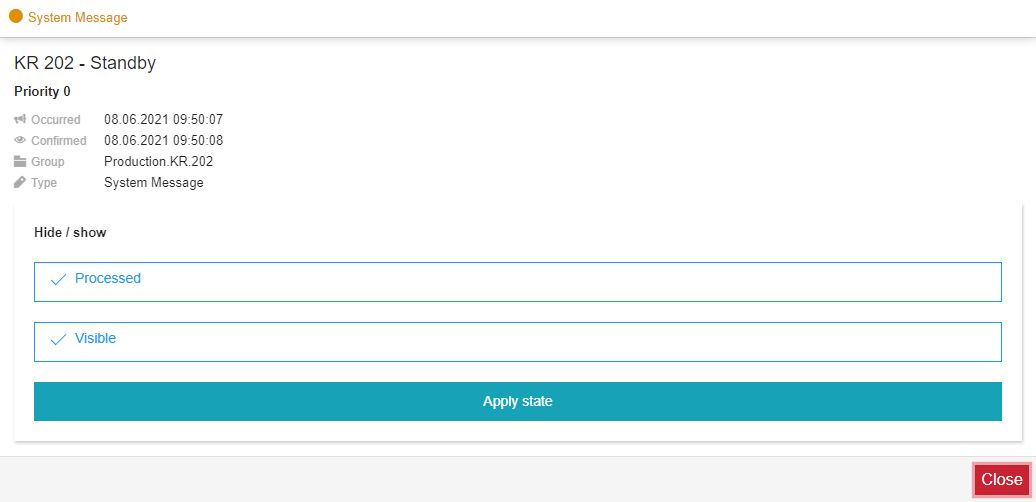
Acknowledged and gone alarms
Navigate - in this area you can navigate to various URLs, such as the Additional alarm URL, the Alarm source, and the Alarm target, assuming that such navigation links are provided for the alarm.
Hide / Show - in this area, you can change the alarm state, by enabling/disabling the Processed and Visible states. After clicking the Apply state button, the selected alarm will be made available in the Alarm State Manager table, as soon as the browser page is refreshed.
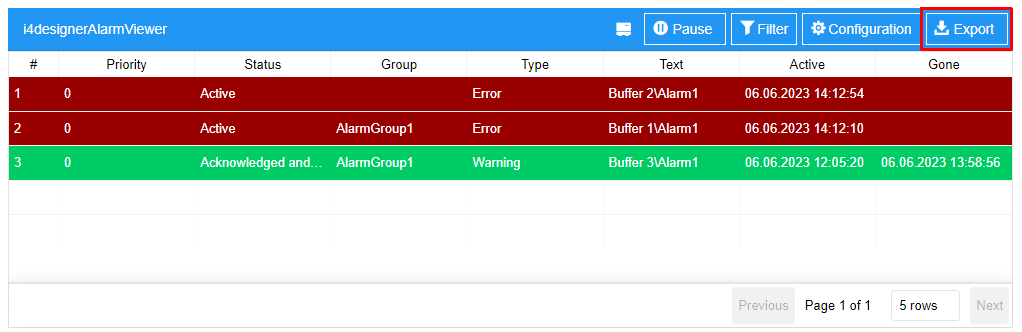
The Export button enables a direct browser download, of all the currently listed alarms via CSV format.
The Acknowledgement button enables the user with the possibility to acknowledge alarms. By clicking this button, the Acknowledgement dialogue pops up allowing the user to organize a set of bulk acknowledgement operations.
The Acknowledgement dialogue allows the user to select the alarms to be acknowledged by choosing from the drop-down list options:
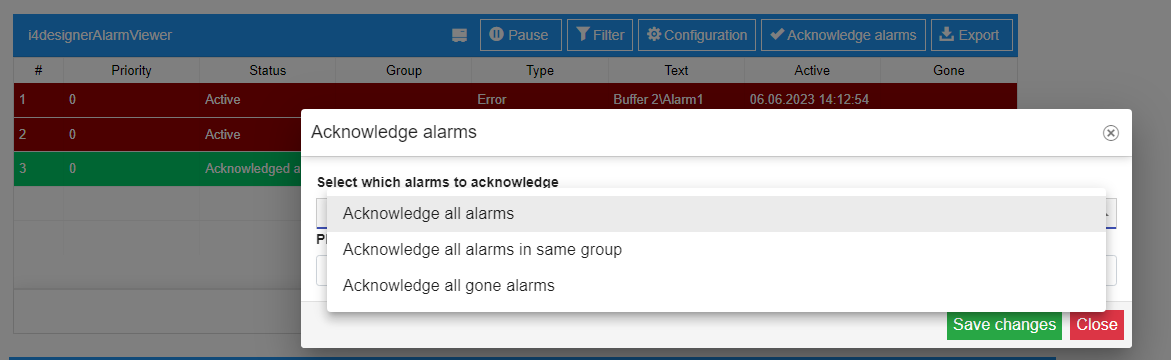
Acknowledge all alarms
Acknowledge all alarms in same group
Acknowledge all gone alarms
After selecting the desired acknowledgement method, the user can fill in a comment to accompany it. As this is a free text field, the user can type in any relevant information.
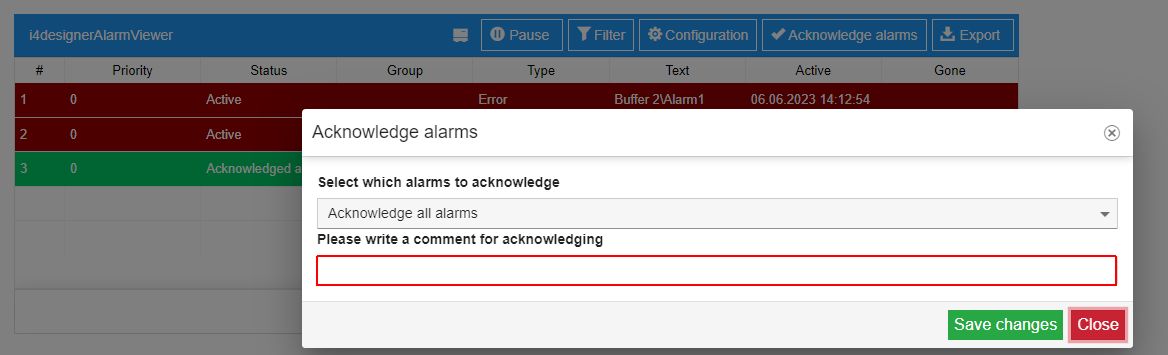
Note
The Alarm Viewer does not display the Acknowledge alarm button unless an active i4SCADA user is logged in.
Let's check the Alarm State Manager component and learn how to manage the states of your alarms:
Warning
By changing the state of an alarm, using the Alarm viewer, the user needs to manually refresh the browser, in order to update the Alarm State Manager table.
Make sure you are logged in on the visualization page.
Warning
Having an integrated security feature only the logged-in users having the appropriate set of permissions will be allowed to actually interact with the Alarm States.
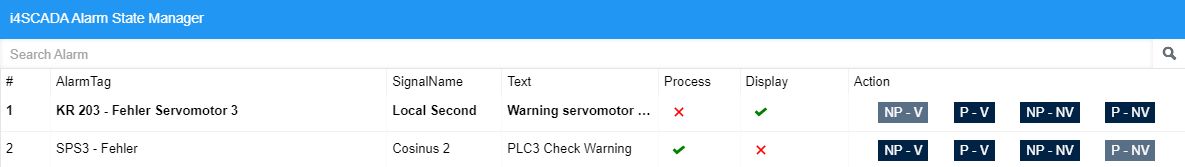
Check the list of alarms and select the one that requires further changes. Selected alarms will be highlighted in the list view.
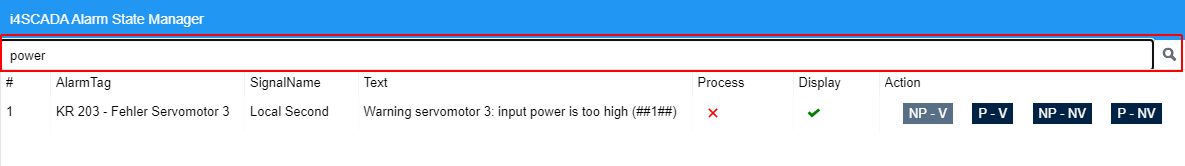
Tip
The Alarm State Manager component provides a straightforward filtering system. The user is able to search for alarms by typing in the name, or a part of the alarm name, in the dedicated search bar.
The user can also sort the Alarm State Manager component columns by clicking the column headers. The list of alarms is sorted on basis of the contents of the column selected as sorting reference. The sorted columns can be easily identified due to the applied highlight. The columns are sorted in ascending or descending order, depending on their contents. To change the sorting direction (from ascending to descending or vice-versa) the user can click again on the column header.
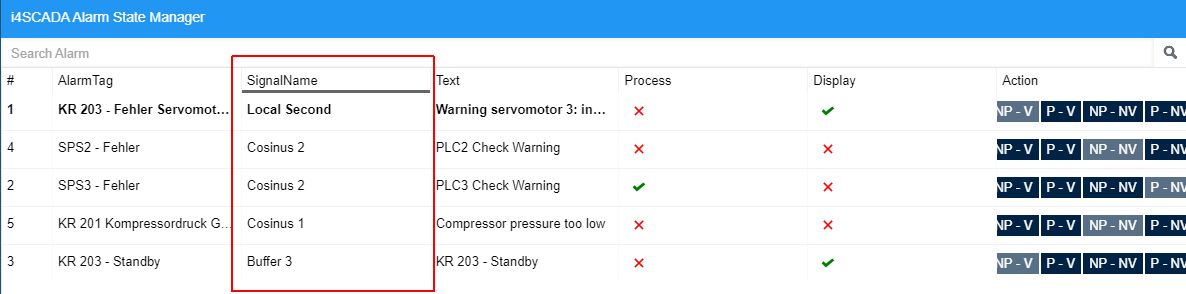
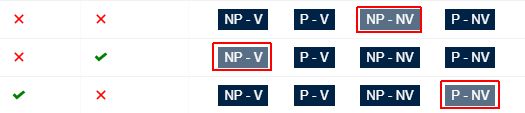
The Alarm State Manager component lists all the alarms that have one or both Processed/Visible states disabled. In this view, the user can change the alarm states, using the state buttons in the Actions column, as follows:
NP-V - Sets the NotProcessed and Visible state.
P-V - Sets the Processed and Visible state. Setting this state will remove the alarm from the Alarm State Manager list.
NP-NV - Sets the NotProcessed and NotVisible state.
P-NV - Sets the Processed and NotVisible state.
Note
The current alarm state action button is deactivated. Also, the user can easily read the state of an alarm in the Process and Display columns.
Last, but not least, let's check the Logbook component, and learn how to use it to communicate with other users:
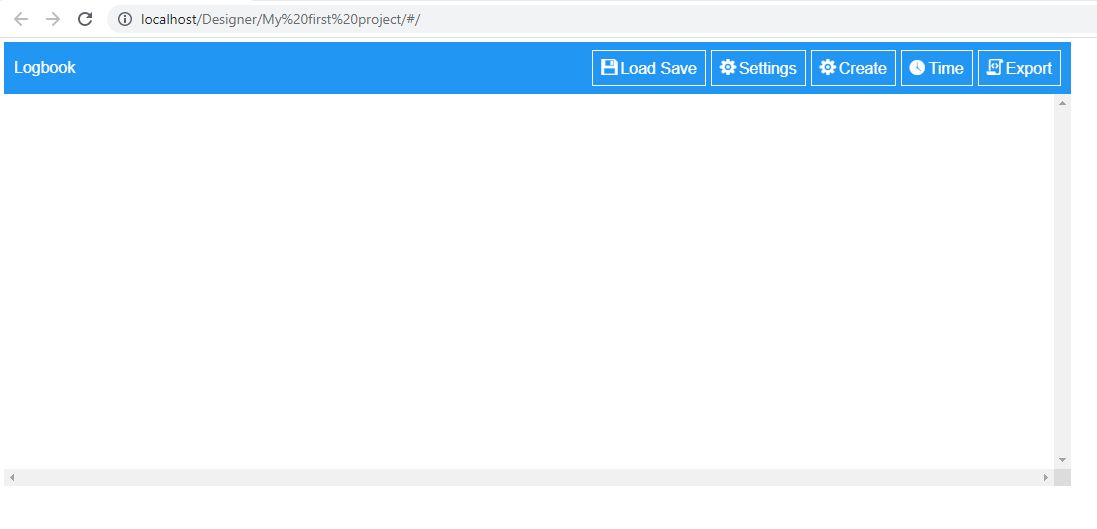
The Logbook component is available on the project visualization page, displaying all the available logbook messages. If no messages are yet available, the list will be empty.
Tip
Since the Logbook has no integrated security feature, you are not required to be logged in on the visualization page.
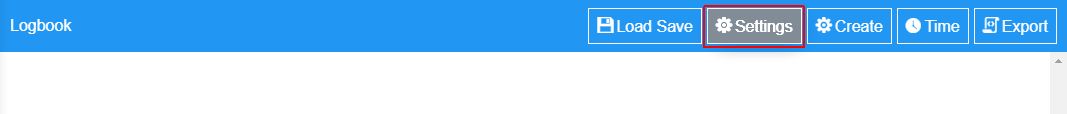
Click on the Settings button, to apply some filters to the list of logbook messages. The Logbook Settings dialog provides the following filtering options:
The Maximum Count Entries setting allows the user the possibility to select the maximum number of logbook messages displayed by the Logbook component. The user can manually type in the desired value or use the up/down arrows to select the value.
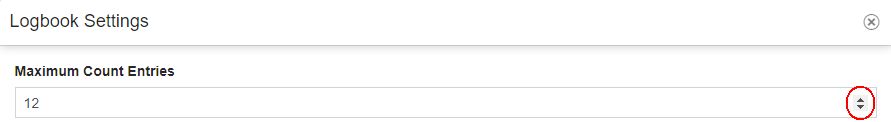
Further on, the user can apply the number of Maximum Count Entries at design time, by changing the value of the Max entries property.
Warning
In case the Logbook displays a total of 20 entries and the Maximum count entries setting is set to value 5, only the last chronological entries will be displayed.
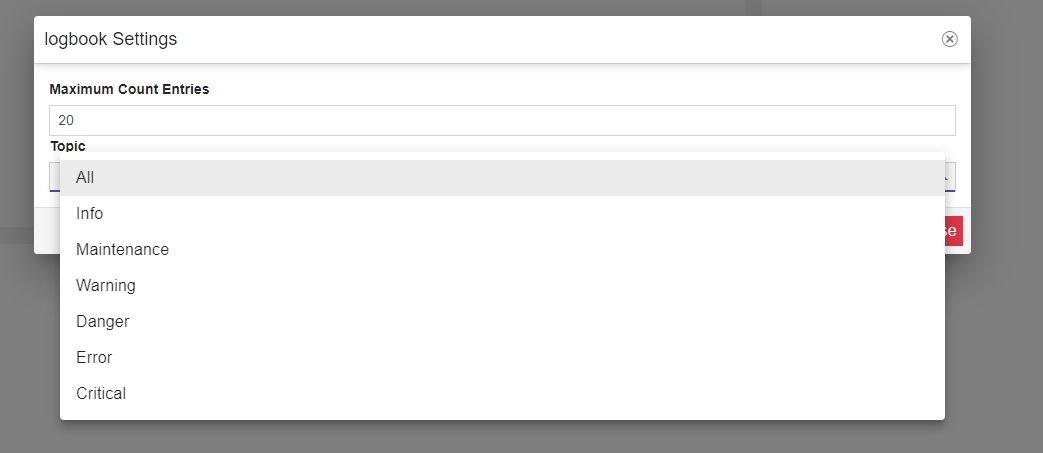
The Topic setting allows the user to filter the logbook messages on basis of the Logbook topic, by selecting a topic from the drop-down list.
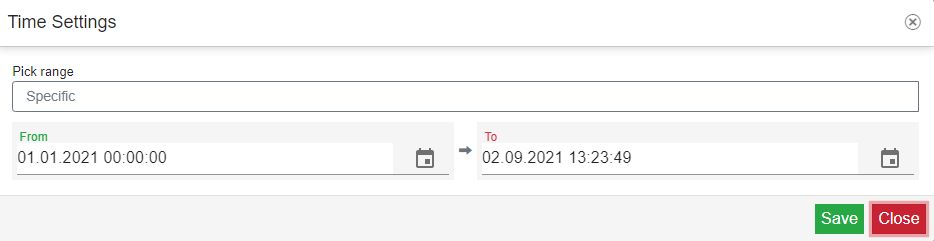
To apply further filters concerning the logbook's time frame, click on the Time button.

The Time Settings panel allows you to select various time ranges, as follows:
Date range Offset - allows the user to pick the current filter, on a specified date, using the design-time properties Start offset and End offset, by choosing the type (seconds, minutes, hours, days).
The time frame is by default calculated and set.
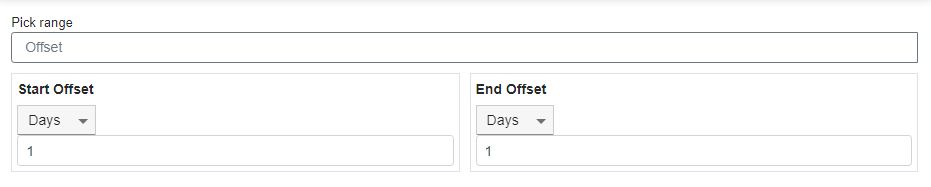
Start offset interval - Allows the user to specify the start length offset measured in seconds, minutes, days, weeks, months, or years.
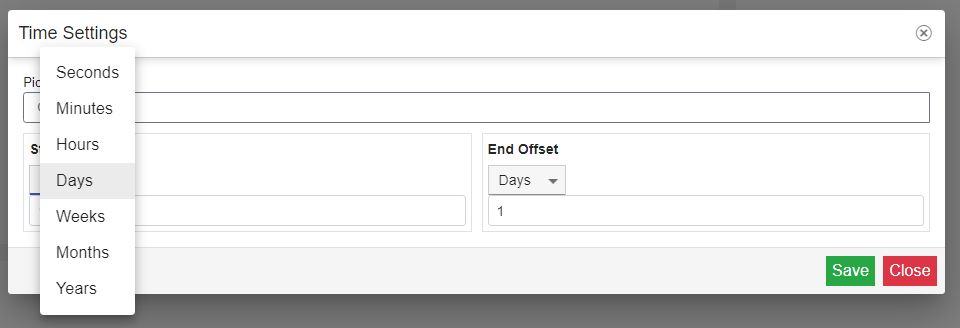
Start offset - Allows the user to set the start offset interval.
End offset interval - Allows the user to set the end offset interval.
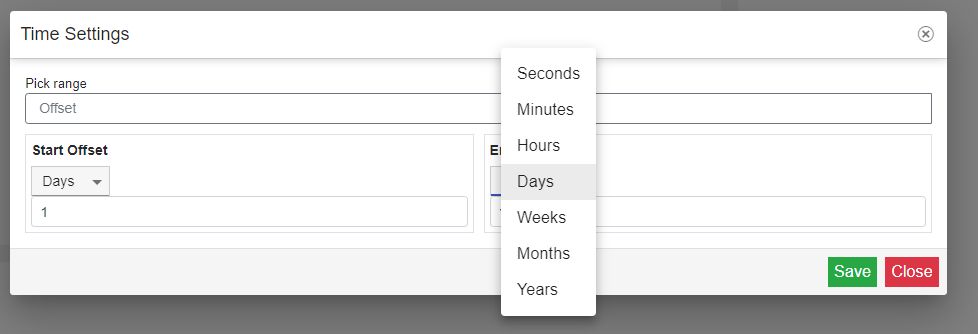
End offset - Allows the user to specify the end length offset measured in seconds, minutes, days, weeks, months, or years.
Date range Specific - allows the user to pick the desired time interval, using the Start date / End date calendar selectors.
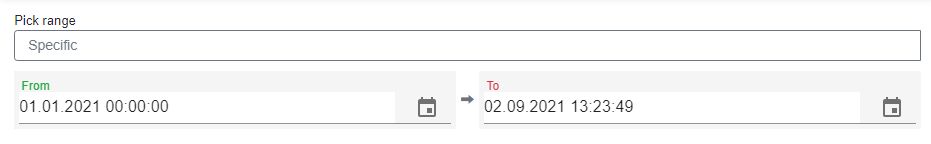
Start date - sets the start date of the component measurement.
End date - sets the end date of the component measurement.
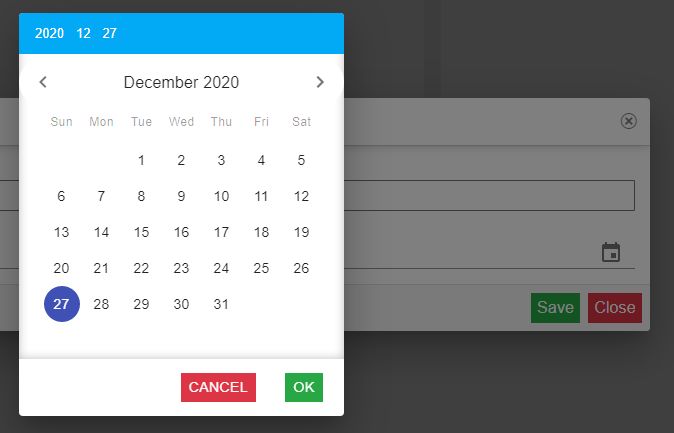
Date range Day - allows the user to select the desired Day as time range, from the calendar view.
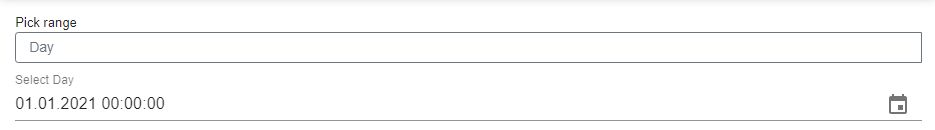
Date - sets the date range, to a specific day.
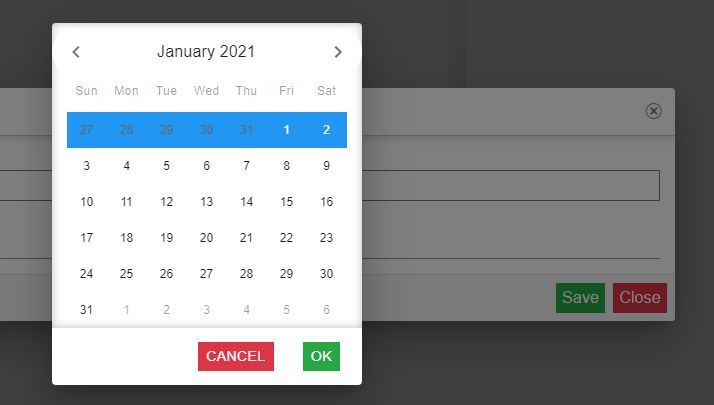
Date range Week - allows the user to select the desired Week as time range, from the calendar view.
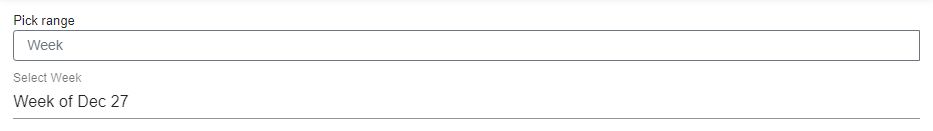
Date - sets the date range, to a specific week.
Date range Month - allows the user to select the desired Month as time range, from the calendar view.
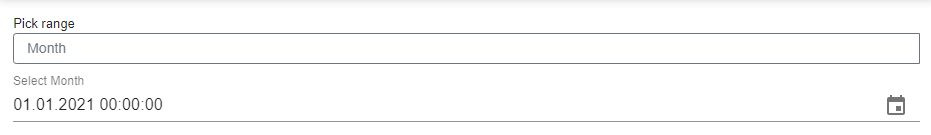
Date - sets the date range, to a specific month.
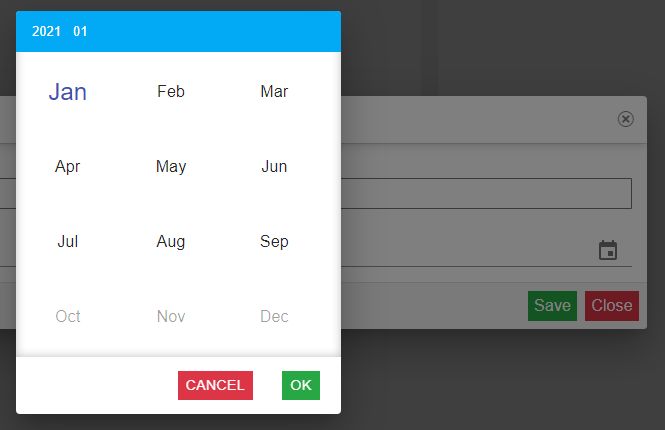
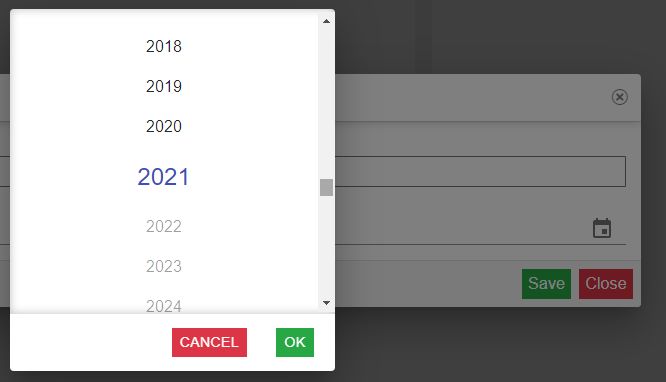
Date range Year - allows the user to select the desired Year as time range, from the calendar view.
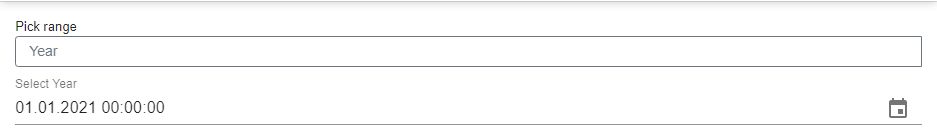
Date - sets the date range, to a specific year.
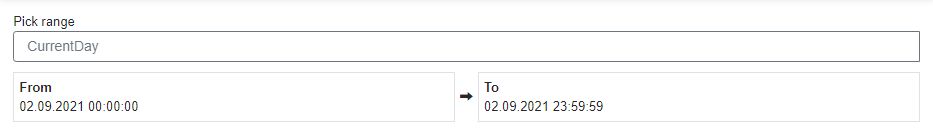
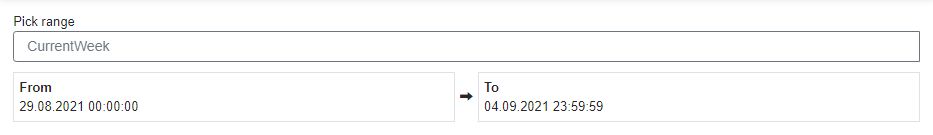
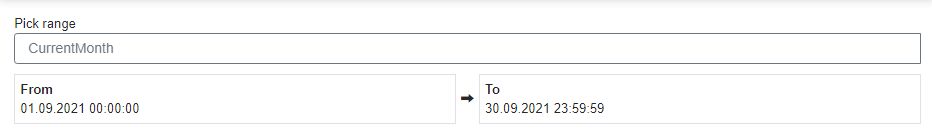
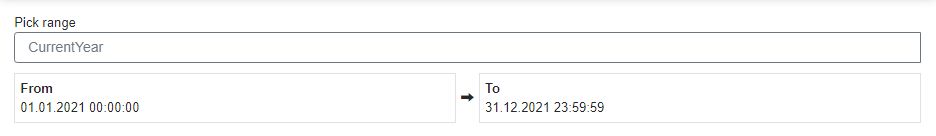
Date range Current day/Current week/Current month/Current year:
Current day - allows the user to select the current day, as time range. The time frame of 24 hours is by default calculated and set.
Current week - allows the user to select the current week, as a time range. The time frame of 7 days is by default calculated and set.
Current month - allows the user to select the current month, as a time range. The time frame is by default calculated and set.
Current year - allows the user to select the current year, as a time range. The time frame is by default calculated and set.
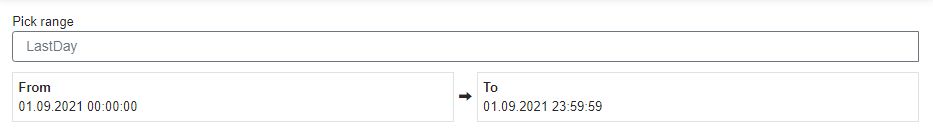
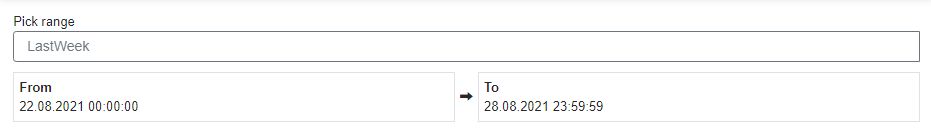
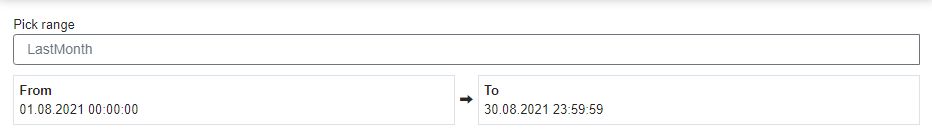
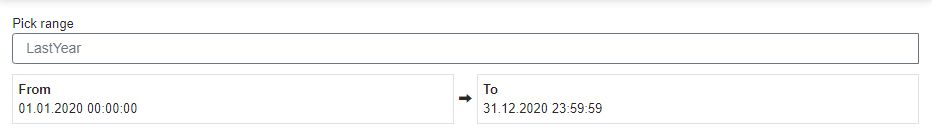
Date range Last day/Last week/Last month/Last year
Last day - allows the user to select the day before the current one. The time frame of 24 hours is by default calculated and set.
Last week - allows the user to select the week before the current one. The time frame of 7 days is by default calculated and set.
Last month - allows the user to select the month before the current one. The time frame is by default calculated and set.
Last year - allows the user to select the year before the current one, as time range. The time frame is by default calculated and set.
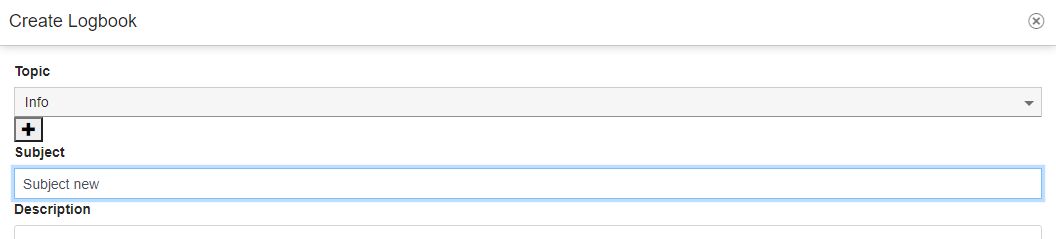
To add a new logbook message, click on the Create logbook button.

The Create Logbook dialog allows you to create logbooks as follows:
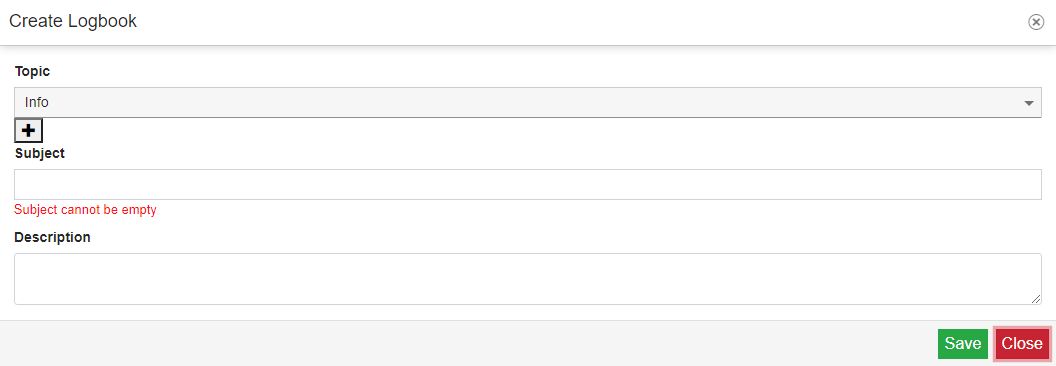
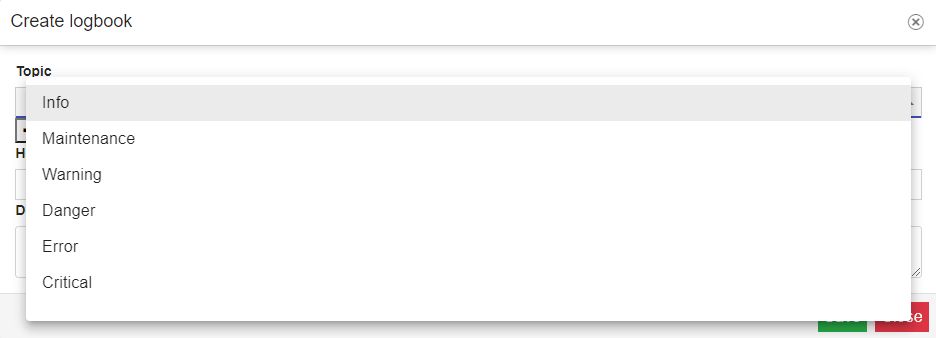
Select a topic for the new Logbook message, using the Topic drop-down list.
Important
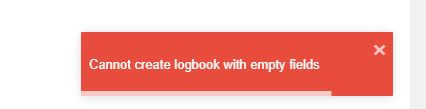
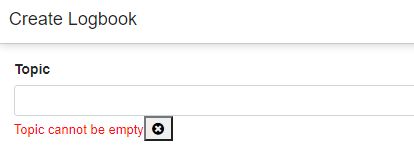
The Topic field can not be empty! In the attempt to create a new logbook with empty fields, no entity is saved and a toast error message is displayed.
Tip
The topics list is populated with a set of default topics, such as "Info", "Warning", "Danger", "Error", "Critical", "Maintenance", and "Success".
The user can create custom Topics, by clicking the Add button.
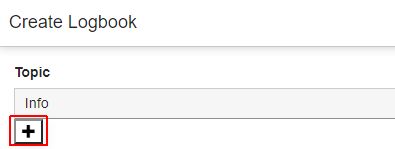
After clicking the Add button, the user is required to type in the name of the new Topic.
After confirming the new topic it is mandatory that a Logbook message using it is created and saved. Otherwise, the new topic will not be preserved
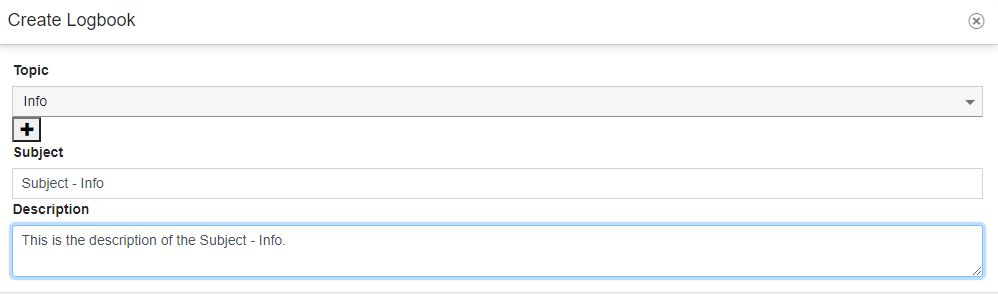
Type in the Subject field a subject for the new topic.
Important
The Subject field can not be empty! In the attempt to create a new logbook with empty fields, no entity is saved and a toast error message is displayed.
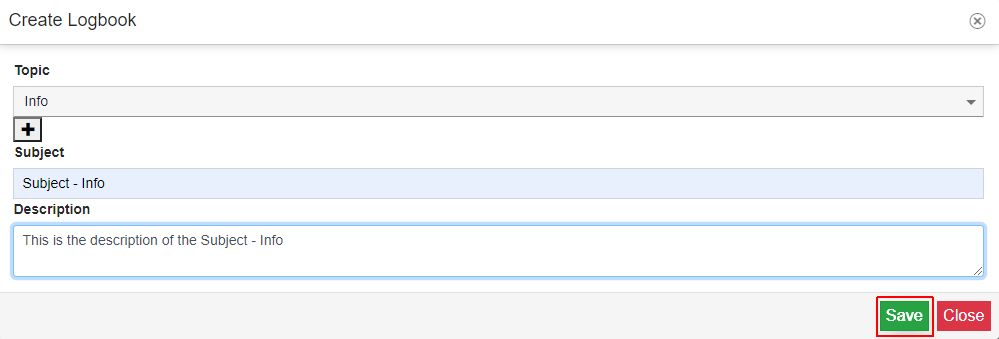
Type your message in the Description field.
Click the Save button to release the new Logbook message.
A toast message will be displayed, confirming the successful save operation.
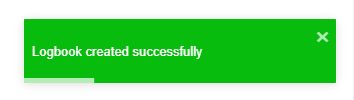
The new Logbook message is visible in the list.
Warning
The list of Logbooks is automatically updated to display the last version of the list.
However, depending on the Time filter settings it may be the case that some Logbook messages will not be listed if the date of creation is outside of the time frame applied as Time filter.
Tip
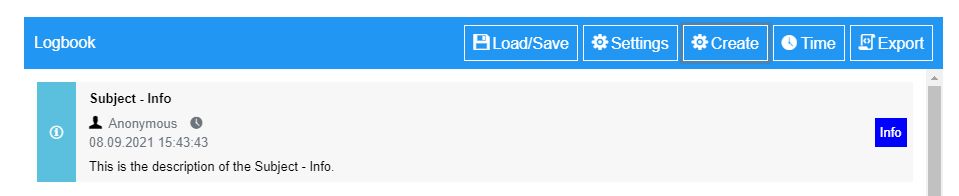
Logbooks are displayed as cards in a scrollable list view. Each Logbook card displays the following information:
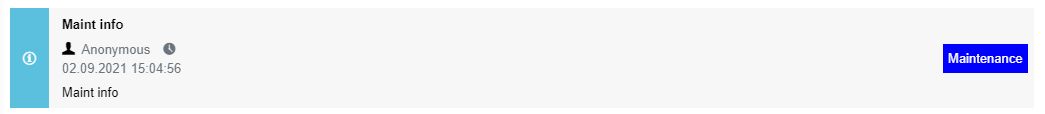
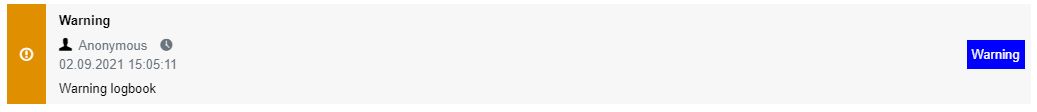
The Logbook label is displayed on basis of the Logbook's topic, along with the topic icon.
Blue label displayed for Info, Maintenance, and all the Logbooks using new Topics.
Yellow label displayed for Warning Logbooks.
Red label displayed for Critical, Error, and Danger Logbooks
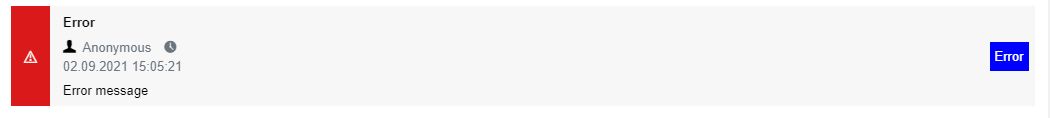
Logbook subject
Logbook creator used
Logbook date and time of the creation
Logbook description/text.
Warning
Saved Logbooks can no longer be updated or deleted!
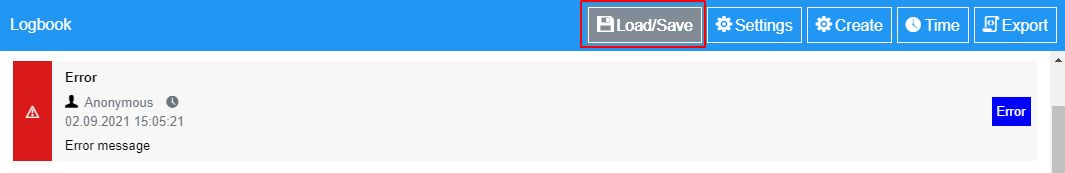
To save a previous configuration, click the Load/Save toolbar button.
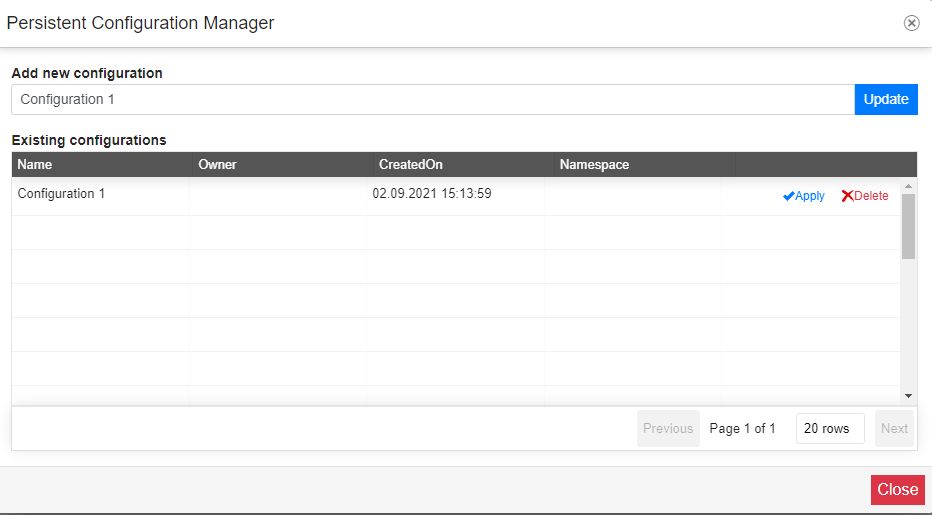
The Persistent Configuration Manager dialog is opened. In the Add new configuration field, type in the name of your configuration and click the Add button. The configuration will be made available in the list of Existing configurations.
Tip
For more details about the Persistent Configuration Manager dialog, please also visit the dedicated i4connected article, here.
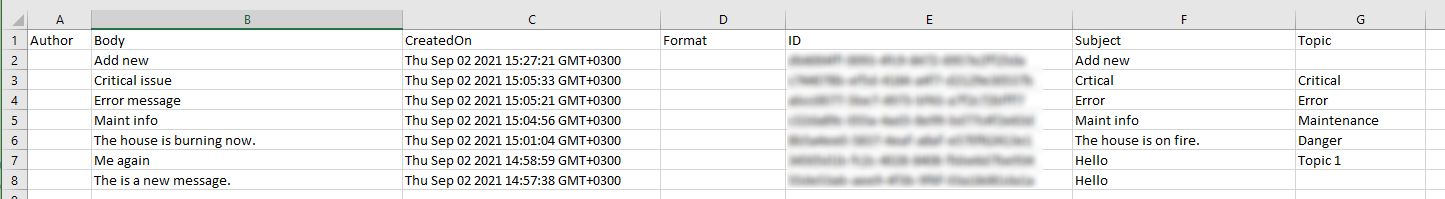
Click the Export toolbar button to obtain a CSV output of the logbooks list. The exported content will be saved on your local machine, to a storage location of your choice.
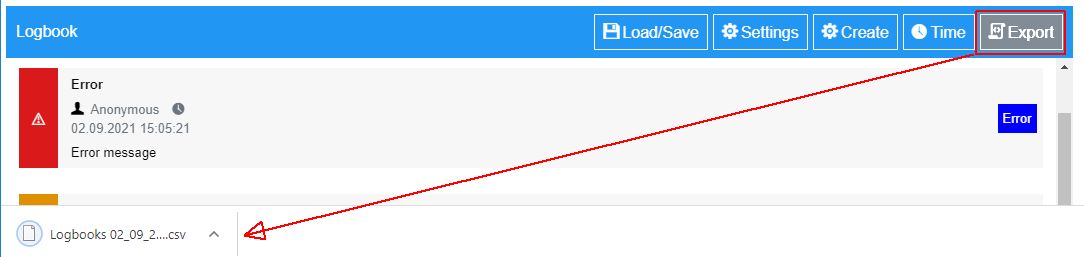
The Logbooks document is saved in CSV format.