i4designer KPI Provider tutorials
Check out these articles and learn how to configure the KPI provider component, to expose analysis data using local signals on basis of predefined conventional patterns.
Exposing analysis data using the KPI Provider component
Check out this article and learn how to easily build a project exposing data analysis information, using the KPI Provider component.
The i4designer KPI Provider component allows users the possibility to easily expose analysis data on the basis of predefined conventional patterns using client signals.
Tip
A Client-side signal is a signal that only exists in the client application and has a lifetime that is directly related to the session's lifetime. Client-side signals are identified by the case-sensitive prefix: "local://". For more details about Client-side signals please visit the dedicated article, here.
In order to achieve this use case, please follow these steps:
Open an i4connected platform project in design mode.
Important
Make sure that your project already has the i4connected entities synchronized, prior to the below steps.
For more details about i4connected entities synchronization please visit the dedicated article, here.
Open the Toolbox panel and drag the KPI component on your project page.
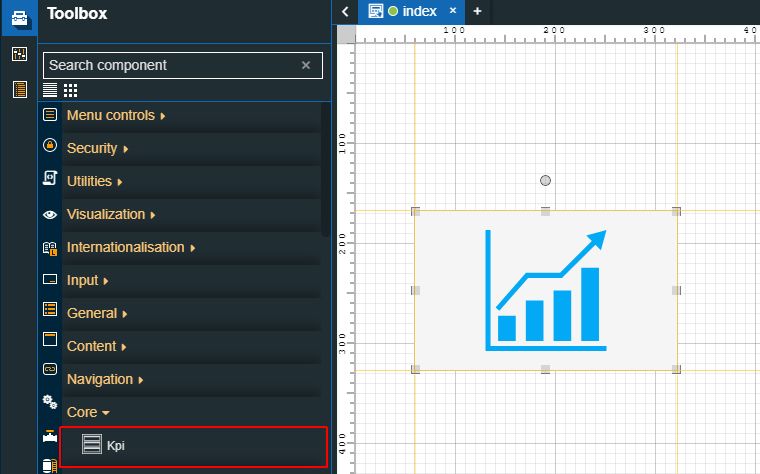
Tip
The KPI component can be placed anywhere on the drawing surface since it will be invisible at run time.
Double click the KPI component in order to open the Properties panel. Proceed with the following settings:
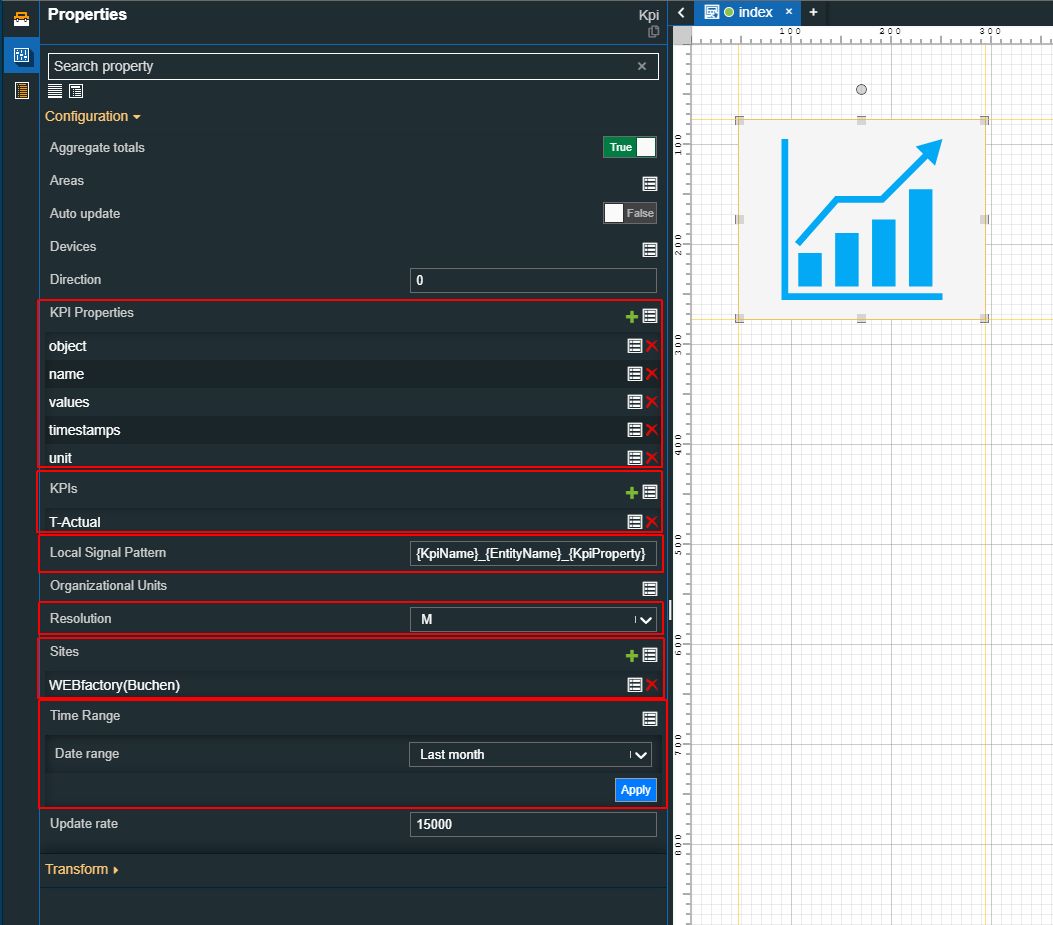
Expand the KPI Properties area, by clicking the Expand array list button, and add the following properties:
object
name
values
timestamps
unit
Expand the KPIs area, by clicking the Expand array list button and add your KPI.
Expand the Sites area, by clicking the Expand array list button and add your Site.
Set the Time range property to point to the desired date range. For this tutorial, we shall apply the "Last month" date range.
Your changes are automatically saved by the i4designer. Make sure to follow up on the visual cue provided by the system each time changes on the whiteboard occur.
Next, let's add five Signal value components to the drawing surface.
Tip
For this tutorial, we accompanied each Signal value component with a Label component, used to describe the expected analysis data, as follows:
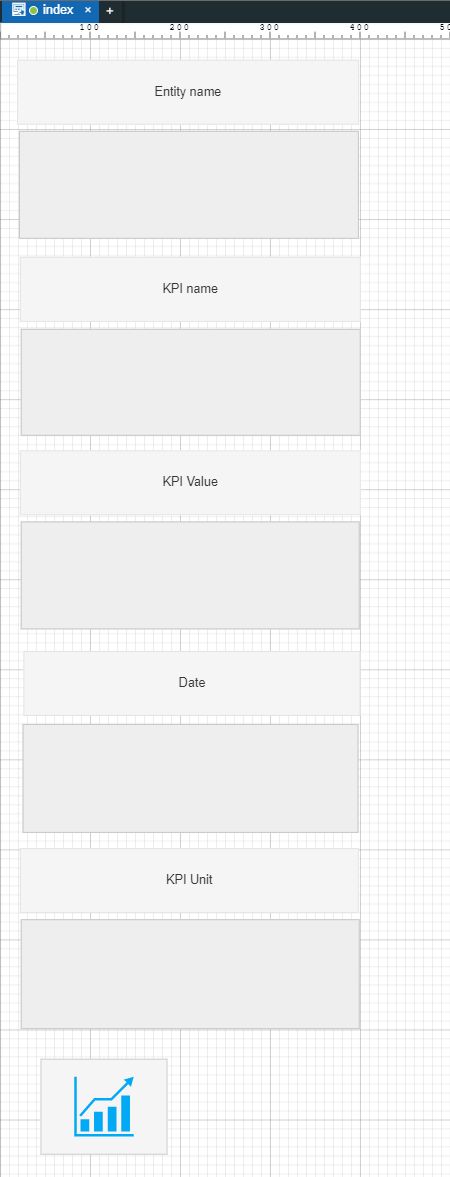
Signal value 1 - should display the Entity Name
Signal value 2 - should display the KPI Name
Signal value 3 - should display the KPI Value
Signal value 4 - should display the date when the value was registered
Signal value 5 - should display the KPI Unit
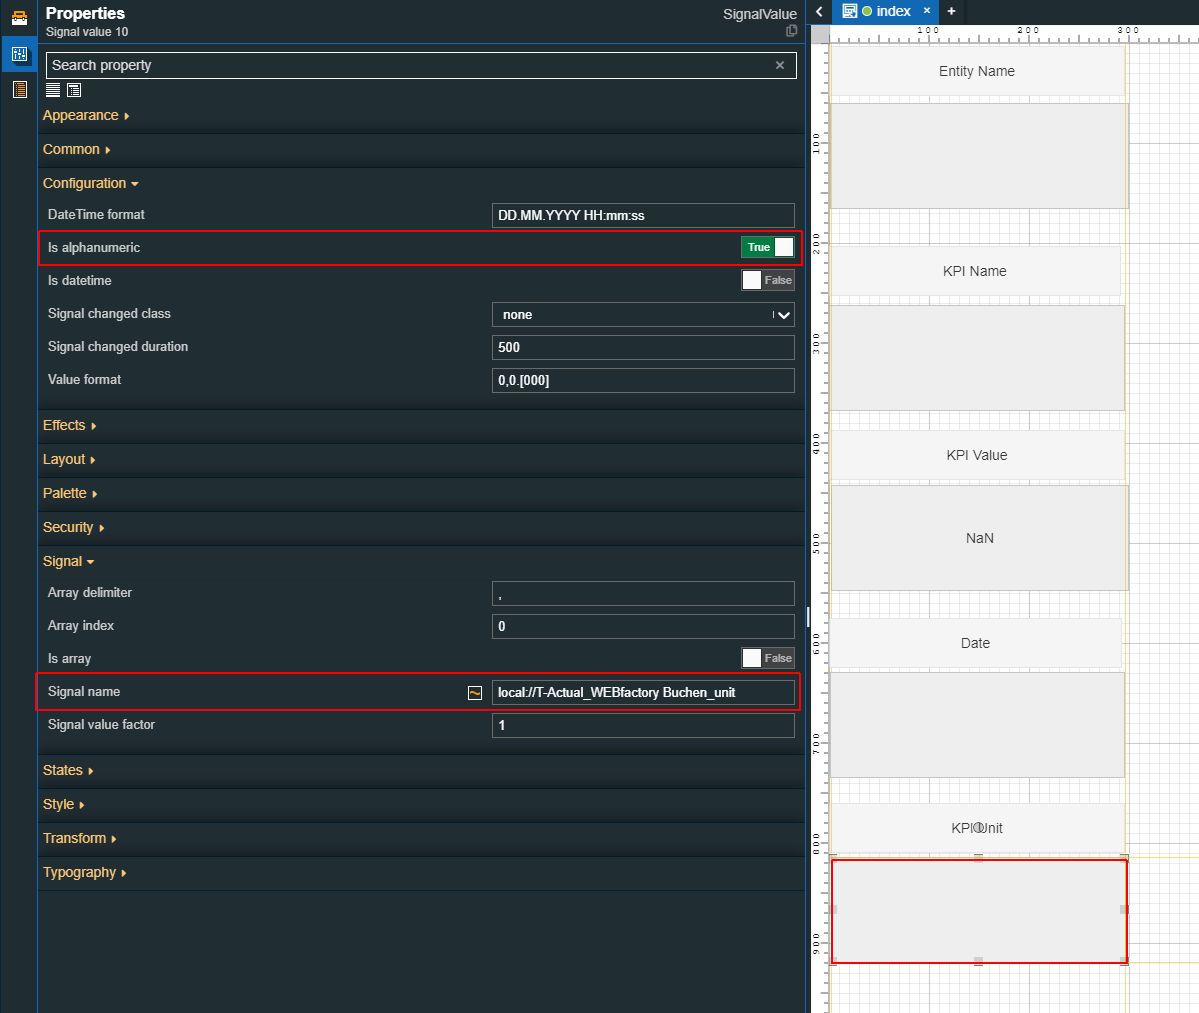
Double click the first Signal value component to open the Properties panel, and proceed with the following settings:
Set the Is alphanumeric property to True.
Set the Signal name using a client-side signal. The client-side signal should respect the Local Signal Pattern defined for the KPI component: local://KPIName_EntityName_KpiProperty". In our case, the KpiProperty is "object" since we want to expose the Entity name.
Double click the second Signal value component to open the Properties panel, and proceed with the following settings:
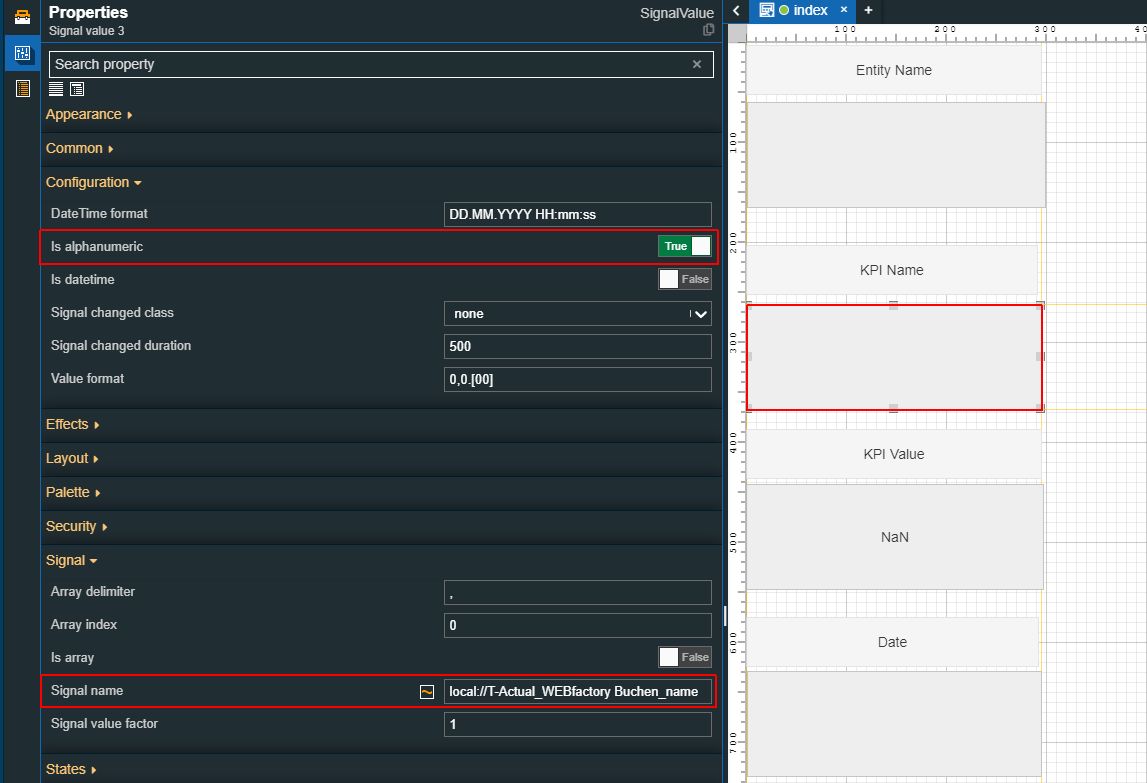
Set the Is alphanumeric property to True.
Set the Signal name using a client-side signal. The client-side signal should respect the Local Signal Pattern defined for the KPI component: local://KPIName_EntityName_KpiProperty". In our case, the KpiProperty is "name" since we want to expose the KPI name.
Double click the third Signal value component to open the Properties panel, and proceed with the following settings:
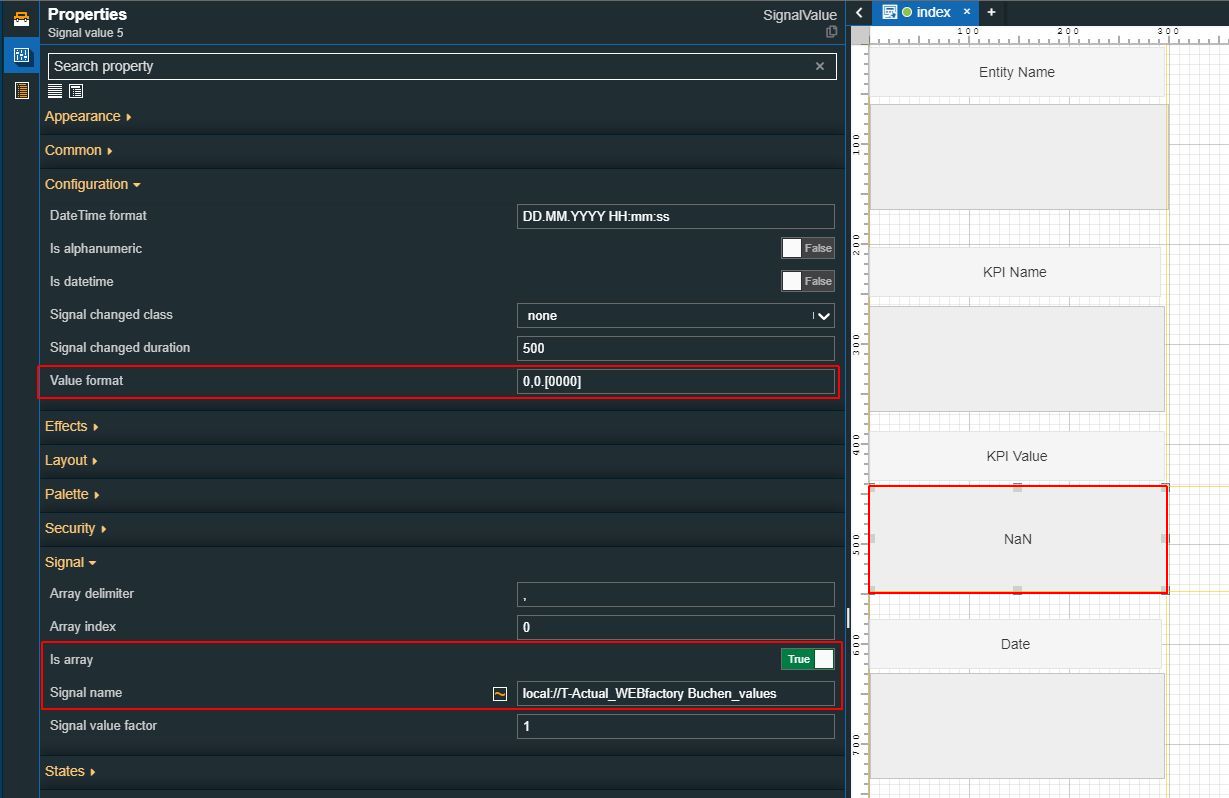
Set the Is array property to True.
Set the Value format property to value 0,0.[0000].
Set the Signal name using a client-side signal. The client-side signal should respect the Local Signal Pattern defined for the KPI component: local://KPIName_EntityName_KpiProperty". In our case, the KpiProperty is "values" since we want to expose the KPI value.
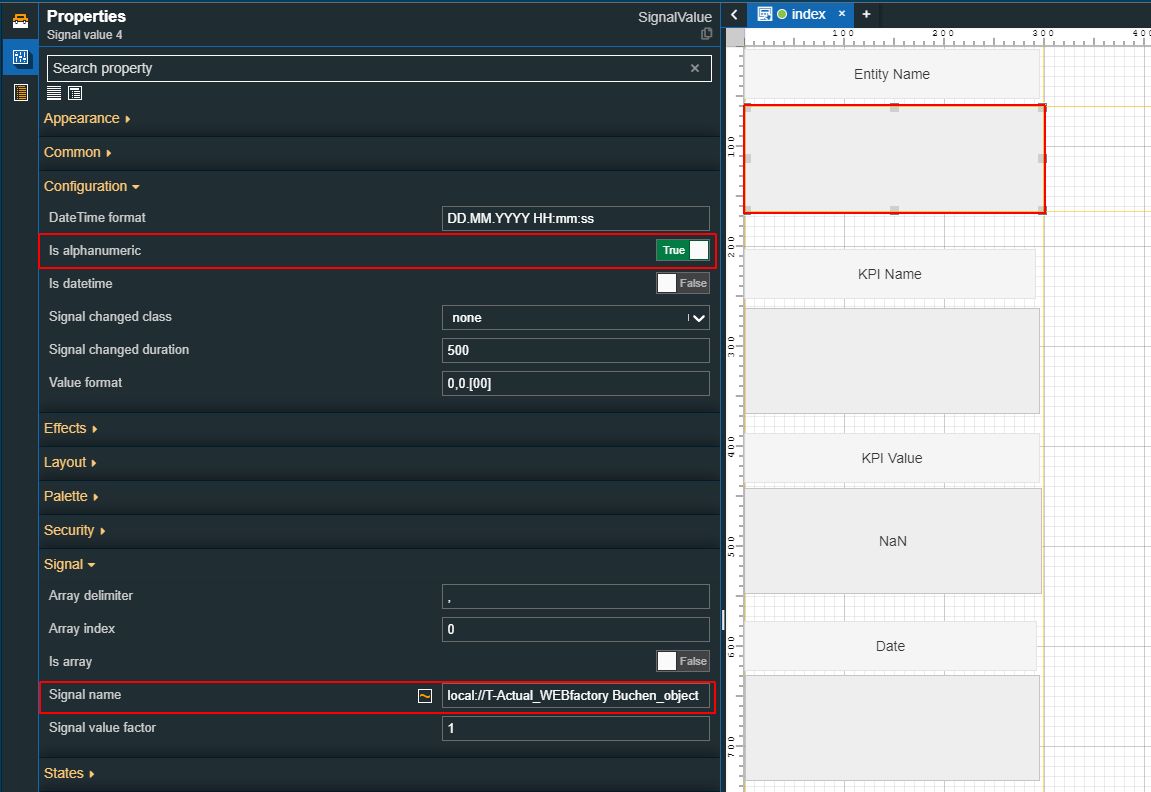
Double click the fourth Signal value component to open the Properties panel, and proceed with the following settings:
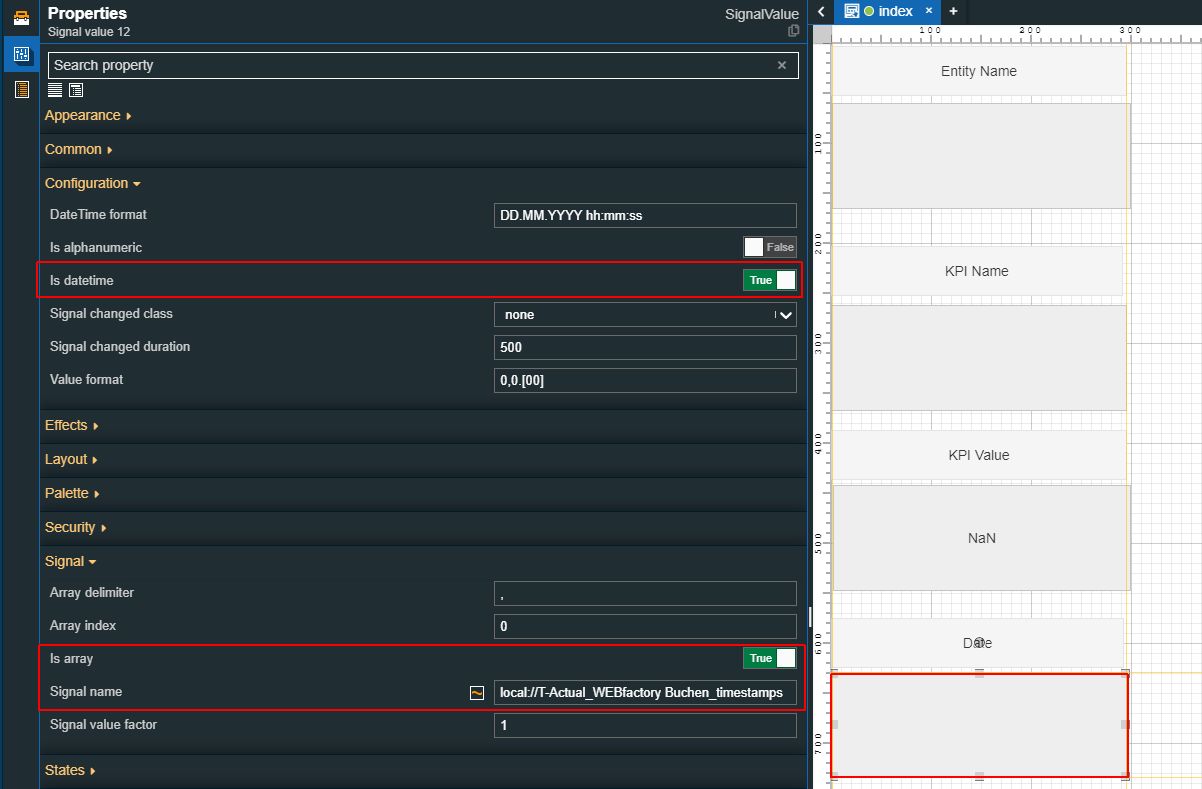
Set the Is datetime property to True.
Set the Is array property to True.
Set the Signal name using a client-side signal. The client-side signal should respect the Local Signal Pattern defined for the KPI component: local://KPIName_EntityName_KpiProperty". In our case, the KpiProperty is "timestamps" since we want to expose the date when the KPI value was registered.
Double click the fifth Signal value component to open the Properties panel, and proceed with the following settings:
Set the Is alphanumeric property to True.
Set the Signal name using a client-side signal. The client-side signal should respect the Local Signal Pattern defined for the KPI component: local://KPIName_EntityName_KpiProperty". In our case, the KpiProperty is "unit" since we want to expose the KPI unit.
Now let's proceed with building and publishing our project, to check the run time results.
Tip
For more details on how to build and publish your i4designer projects to an i4connected environment, please also visit our tutorials section, here.
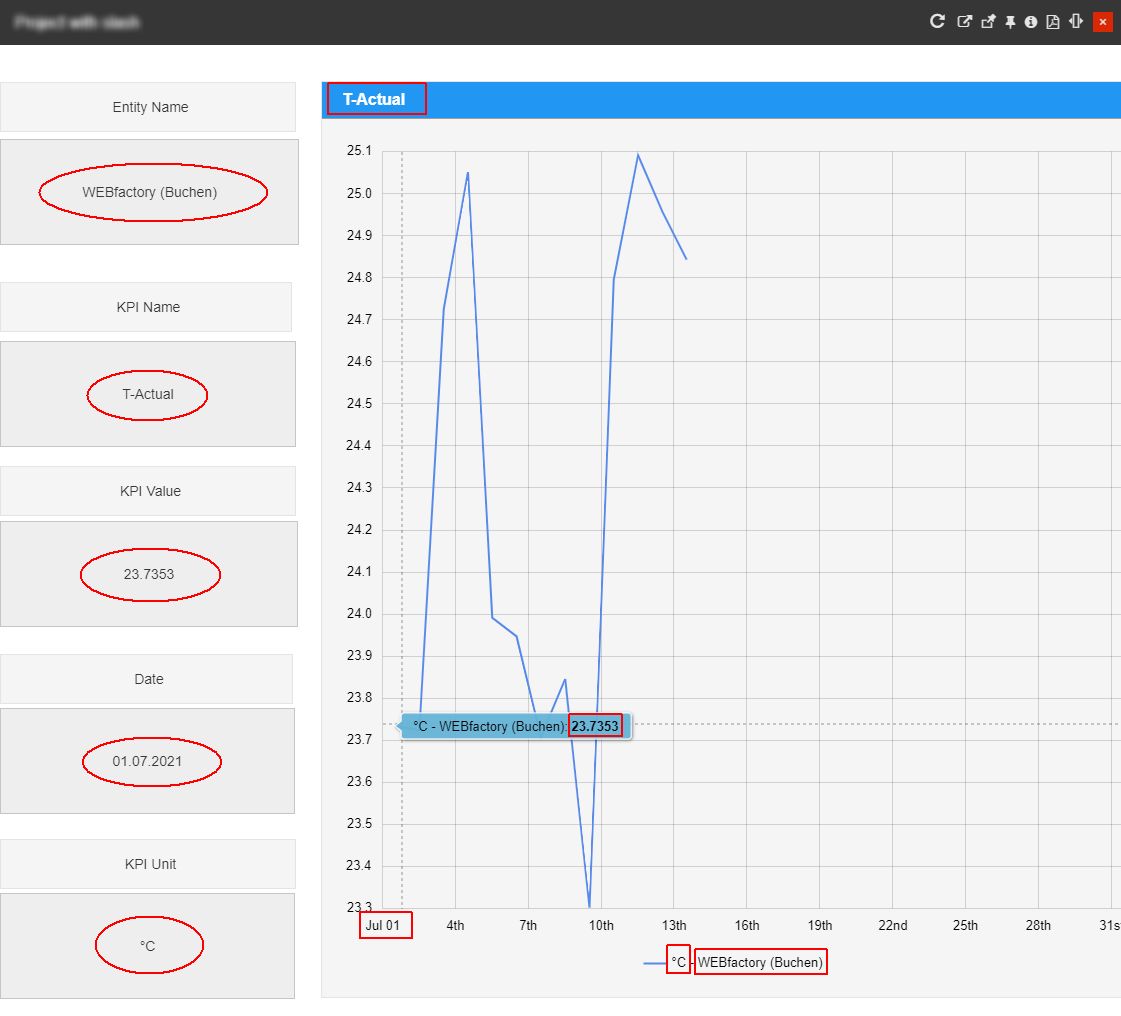
At run time, the Signal value components will expose the following data:
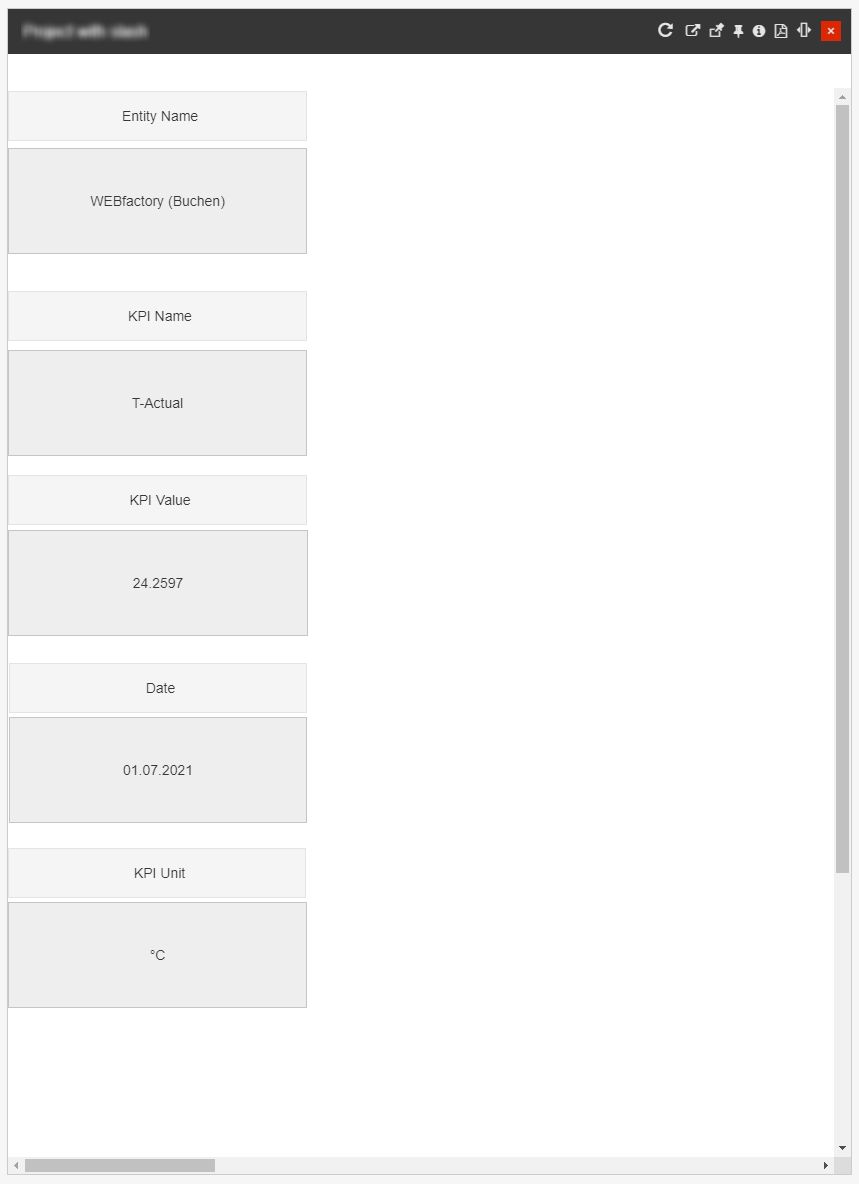
Signal value 1 displays the name of the i4connected hierarchical entity.
Signal value 2 displays the name of the i4connected KPI.
Signal value 3 displays the value of the i4connected KPI.
Signal value 4 displays the date when the KPI value was registered.
Signal value 5 displays the unit of the KPI.
Tip
To have a better overview of the exposed data, you can also add an Analysis chart component, to your i4designer project.