HTML Alarm Manager at run-time
Fully customizable and easy to use, the HTML Alarm Manager provides you with the possibility to view, acknowledge, filter and export your alarms, while at run-time.
This article describes the Ewon by HMS Networksi4scada Alarm and Reporting extensions when in run-time state.
The Alarm State Manager
The Alarm State Manager extension offers a simple yet effective solution for alarm state management. Having an integrated security feature only the logged in users having the appropriate set of permissions will be allowed to actually interact with the Alarm States.
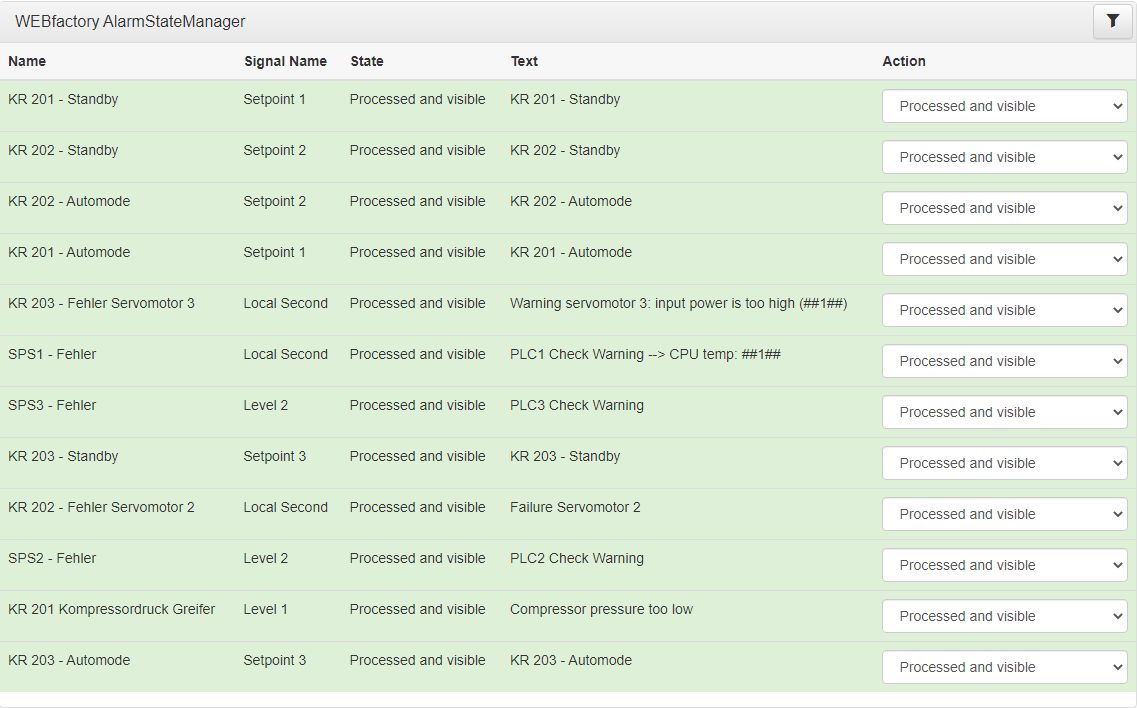
The Alarm State Manager extension
The Alarm State Manager extension provides a straight-forward filtering system, at run-time. The user is able to filter the displayed alarms by clicking the Filter toolbar button.
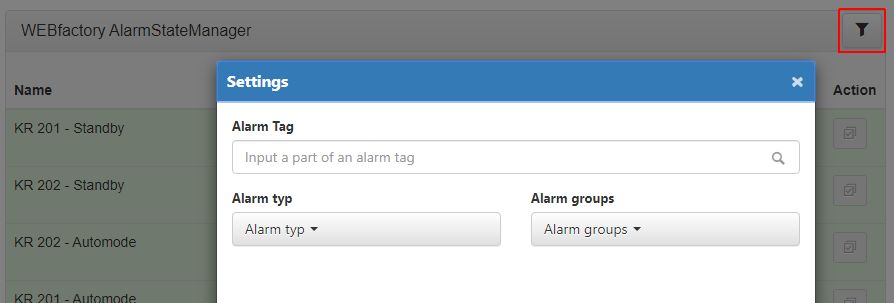
The Filter toolbar button
The Settings dialogue provides the user with the following filtering options that can be used independently or in various combinations:
Alarm Tag - allows the user the possibility to filter the list of Alarms by typing in the name or a part of the Alarm Tag.
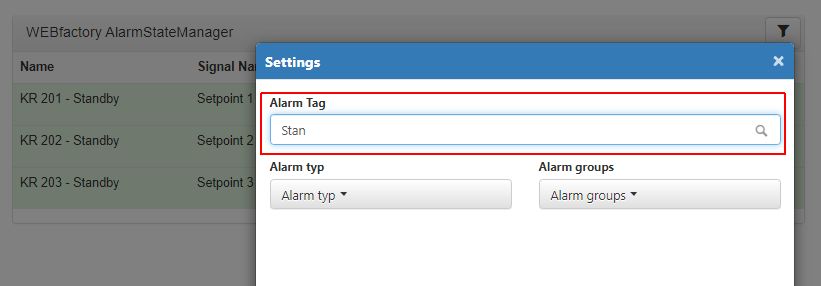
Alarm Tag filter applied
Alarm Type - allows the user with the possibility to filter the list of Alarms by selecting an Alarm Type, choosing from the drop-down list options.
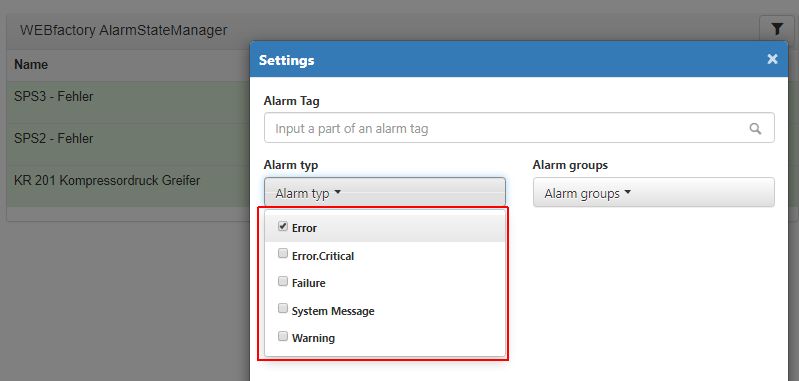
Alarm Type filter applied
Alarm Groups - allows the user with possibility to filter the list of Alarms by selecting an Alarm Group, choosing from the drop-down list options.
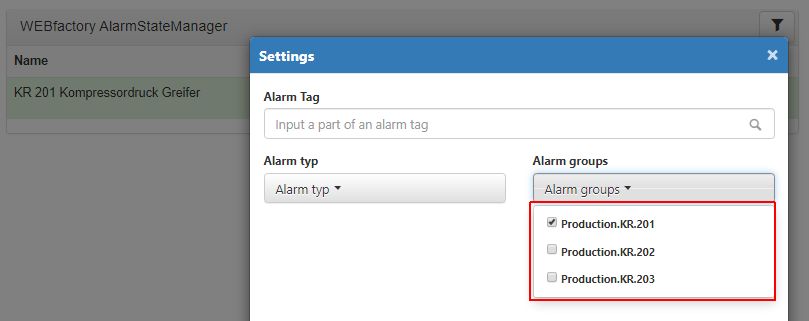
Alarm Group filter applied
As soon as any of the selected filtering options are applied the list of Alarms is filtered accordingly.
The user can also sort the Alarm State Manager extension columns by clicking the column headers. The list of alarms is sorted on basis of the contents of the column selected as sorting reference.
The sorted columns can be easily identified due to the pointing up or down arrows that are applied next to the column header. The columns are sorted in ascending or descending order, depending on their contents. To change the sorting direction (from ascending to descending or vice-versa) the user can click again on the column header.

Example of the sorted column
Besides viewing the listed alarms, the Alarm State Manager extension allows the logged in users to change the status of an alarm by simply pressing the Action drop down button.
The available Actions are:
Not processed but visible
Processed and visible
Not processed and not visible
Processed but not visible
The alarm status change is accompanied by a toast message confirming the update.
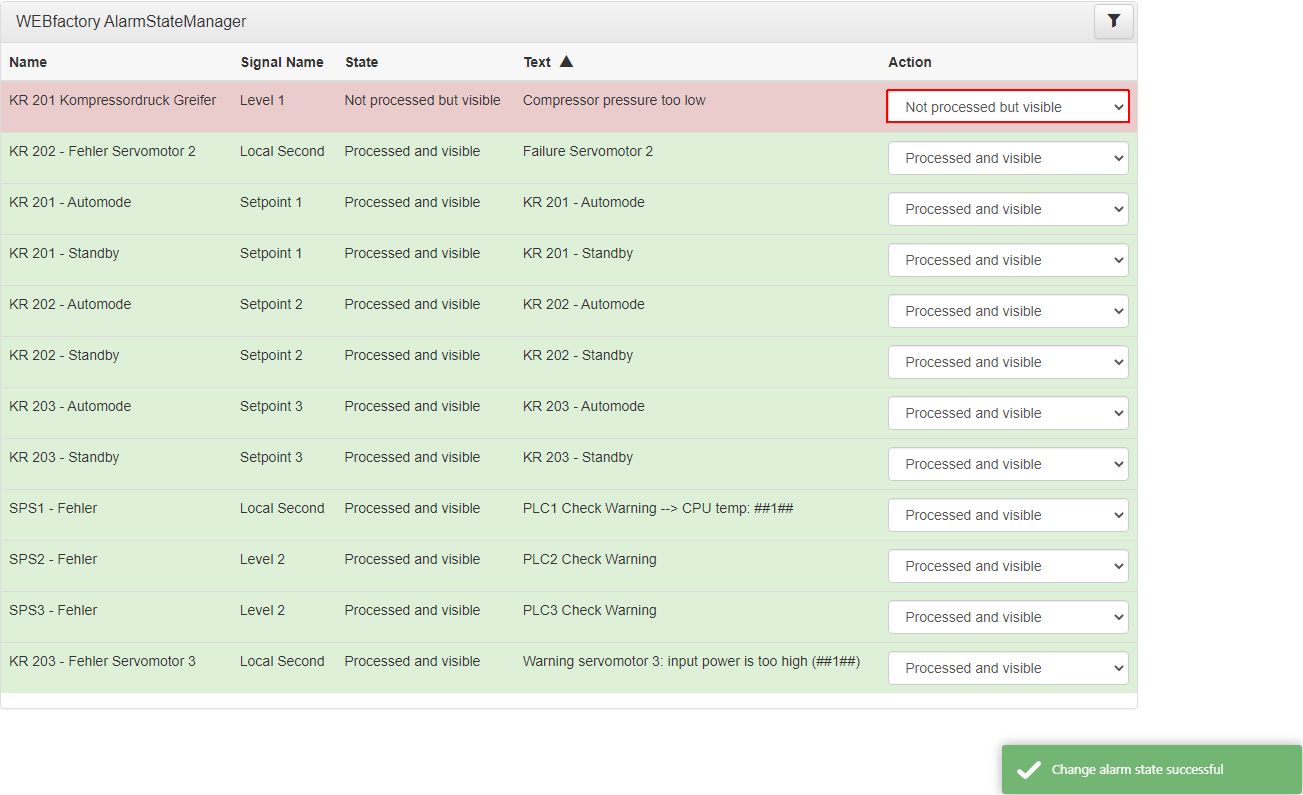
Actions of the alarm states
The Alarm Viewer
The Alarm Viewer is an all-around alarm handling tool that provides complex capabilities like alarm acknowledgement, processing, commenting, filtering and offline alarm viewing. At run-time, the extension provides a detailed alarm status representation using colour codes, textual hints and audio signals.
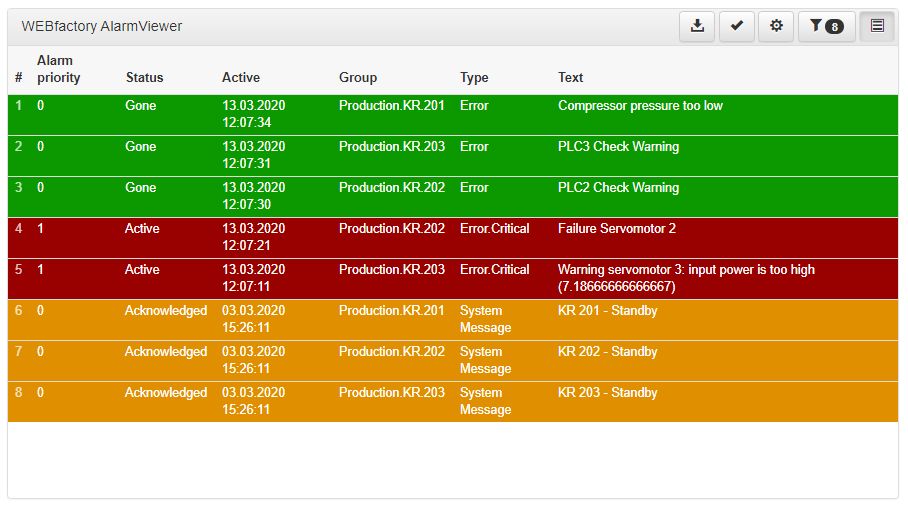
The Alarm Viewer extension
The Alarm Viewer features a set of toolbar options that enable multiple operations:
The Export button enables a direct browser download, of all the currently listed alarms, via CSV format.

The Export button
The Acknowledgement button enables the user the possibility to acknowledge alarms. By clicking this button the Acknowledgement dialogue pops up allowing the user to organise a set of bulk acknowledgement operations.
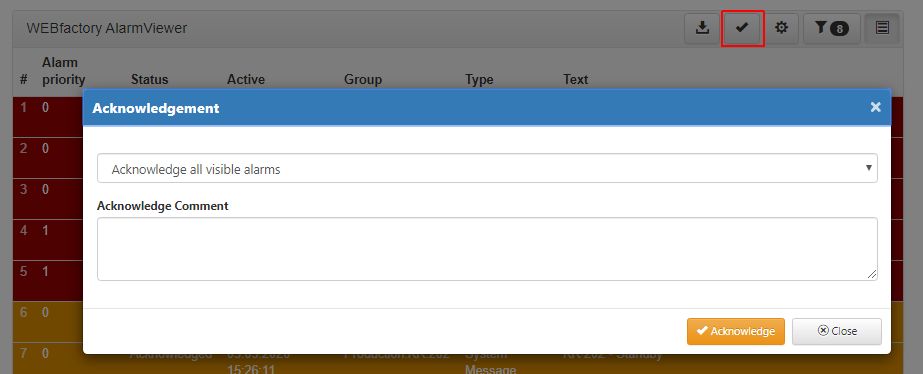
The Acknowledgement dialogue
The Acknowledgement dialogue allows the user to select the alarms to be acknowledged by choosing from the drop-down list options:

The Alarms acknowledgement options
Acknowledge all visible alarms
Acknowledge all alarms in the same groups
Acknowledge all active alarms
Acknowledge all gone alarms
After selecting the desired acknowledgement method, the user can fill in a comment to accompany it. As this is a free text field the user can type in any relevant information.

The Acknowledgement Comment
By clicking the Acknowledge button the selected operation will be processed. To leave the Acknowledgement dialogue without processing any change the user can simply click the Close button.
The Configuration Manager button opens the dialogue with the same name, where the user can save and reuse Filter and Time settings. The Configuration Manager dialogue is split up into three tabs:

The Configuration Manager dialogue
Save - After applying either a Filter or a Time interval, to the Logbook list, by visiting the Configurations manager under the tab Save, the user can preserve the previously applied filters.

The Save Configurations tab
Inserting a new name for the saved configuration is required.
To preserve the configuration press the Save button and to discard the configuration and close the dialogue, press the Cancel button.
Load - All previously saved configurations can be reused, in the Configurations Manager, under the Load tab.
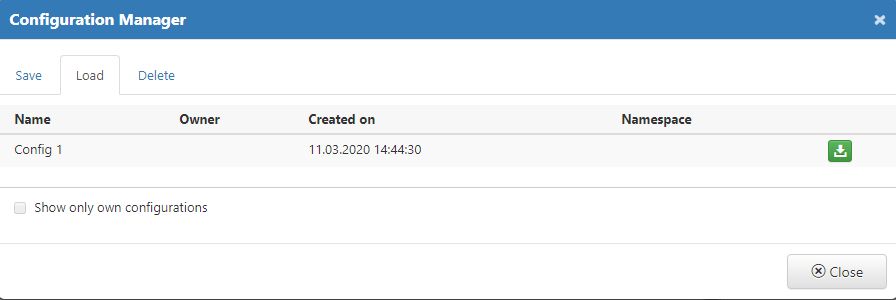
The Load Configurations tab
To load a saved configuration simply click the Load button.The filtering configuration is immediately applied to the list of Logs.
By enabling the option "Show only own configurations" the list is updated to display only those configurations defined by the currently logged in user.
To close the Configuration Manager, without any further actions, click the Cancel button.
Delete - the Configurations Manager allow the user to remove the previously saved configurations, under the tab Delete.

The Delete Configurations tab
To remove a listed configuration press the Delete button.

Deletion confirmation dialog
A confirmation dialog is opened where the available options are Yes (proceed with deletion) and No (do not delete).
The Settings toolbar button opens the dialog with the same name where the user can apply additional settings to the Alarm Viewer.
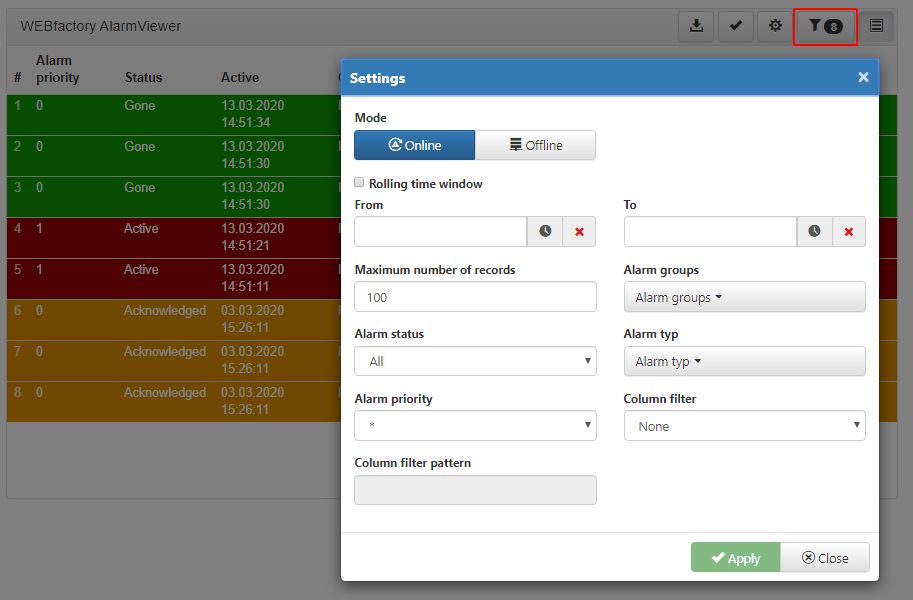
The Settings dialog
Switching between the Online and Offline mode enables the user to organise the following additional filters:
enable the Rolling time window feature in order to apply the Online or Offline mode repeatedly to the sub-data sets or sub-series, in the full data set or series.
set the start date and time using the From selector
set the end date and time using the To selector
set the amount of alarms displayed by the Alarm Viewer by defining the Maximum number or records
set the Alarm status to be displayed by the Alarm Viewer, selecting from the drop-down list options: All, Not Acknowledged, Gone, Active, Active or not acknowledged
set the Alarm priority to be displayed by the Alarm Viewer, selecting from the drop-down list options. The asterisk symbol can be used as a placeholder to display all alarm priorities.
set the Alarm groups to be displayed by the Alarm Viewer, selecting from the drop-down list options.
set the Alarm types to be displayed by the Alarm Viewer, selecting from the drop-down list options.
set the applied Column filter, selecting the desired filter from the predefined drop-down listed items.
apply a Column filter pattern that will be applied to the column selected under the Column filter selector.
The user can change the Alarm viewer display mode by switching between tiles and table view mode.
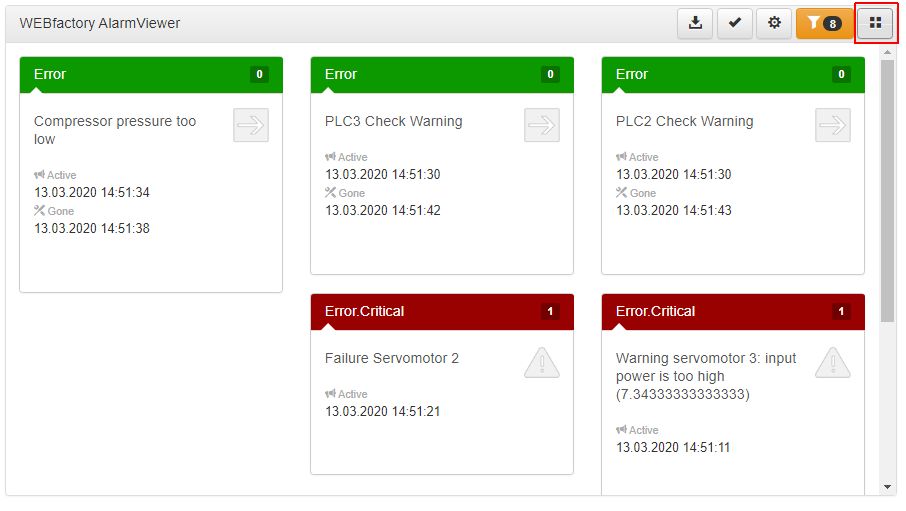
Switch to tile view mode
Further on, the user can interact individually with the listed alarms by selecting them from the list view. A pop up console will be displayed, providing the user with all the alarm details and allowing the user to manage it based on its current status, as follows:
by selecting an Active alarm the user can navigate to the Alarm URL, its navigation source or target. Further on, the user can acknowledge the alarm by its belonging group or individually.
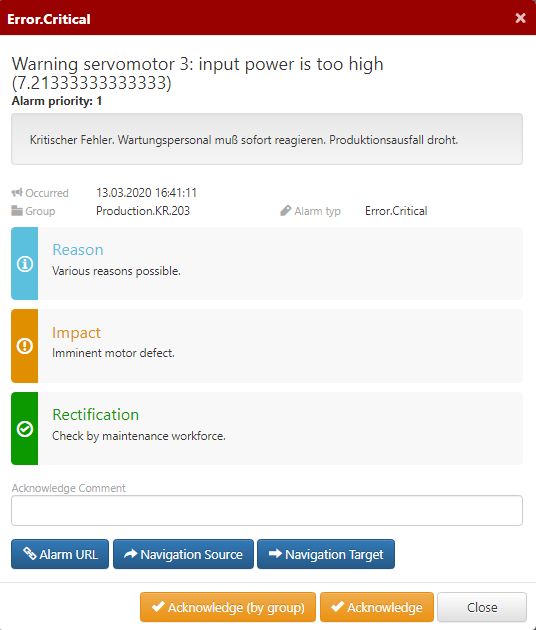
Alarm in status Active
by selecting a Gone alarm the user the user can acknowledge the alarm by its belonging group or individually.
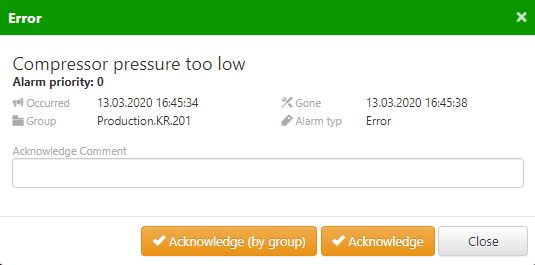
Alarm in status Gone
by selecting an Acknowledged alarm no further actions are available, but the user can read more details about it.
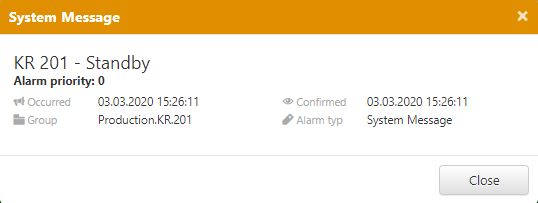
Alarm in status Acknowledged
The Logbook
The Logbook extension enables real-time and multi-user communication environment for Ewon by HMS Networksi4scada web applications. It allows chat-like communications in real-time, while logging the messages for later reading.
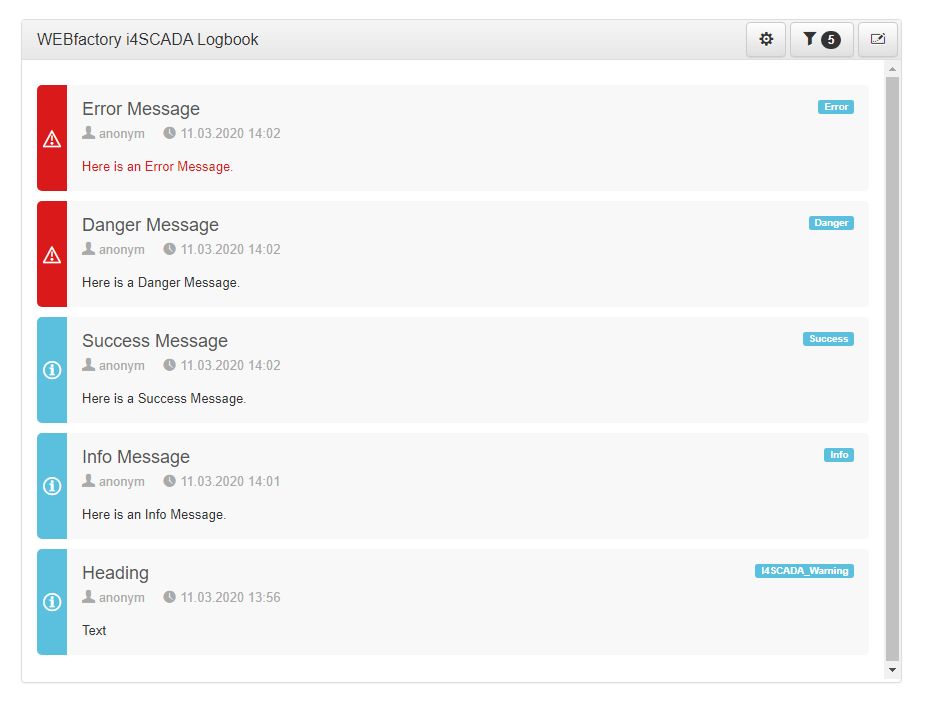
The Logbook extension at run-time
The Configuration Manager toolbar button opens the dialog with the same name, where the user can save and reuse Filter and Time settings. The Configuration Manager dialog is split up in three tabs:

The Logbook Configuration Manager
Save - After applying either a Filter or a Time interval, to the Logbook list, by visiting the Configurations manager under the tab Save, the user can preserve the previously applied filters.

The Save Configurations tab
Inserting a new name for the saved configuration is required.
To preserve the configuration press the Save button and to discard the configuration and close the dialog, press the Cancel button.
Load - All previously saved configurations can be reused, in the Configurations Manager, under the Load tab.

The Load Configurations tab
To load a saved configuration simply click the Load button . The filtering configuration is immediately applied to the list of Logs.
By enabling the option "Show only own configurations" the list is updated to display only those configurations defined by the currently logged in user.
To close the Configuration Manager, without any further actions, click Cancel button.
Delete - the Configurations Manager allow user to remove the previously saved configurations, under the tab Delete.

The Delete Configurations tab
To remove a listed configuration press the Delete button.

Deletion confirmation dialog
A confirmation dialog is opened where the available options are Yes (proceed with deletion) and No (do not delete).
The Settings toolbar button opens the dialog with the same name where the user can apply additional settings to the Logbook.
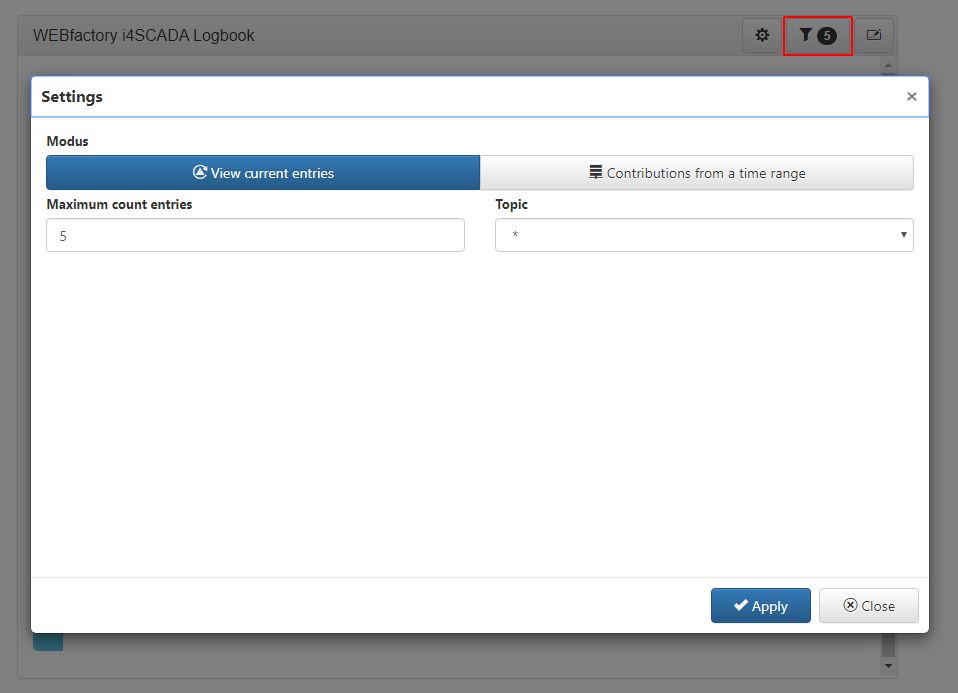
The Settings toolbar button and dialog
In this view, the user can organise the following operations:
Enable the View current entries mode and apply additional settings:
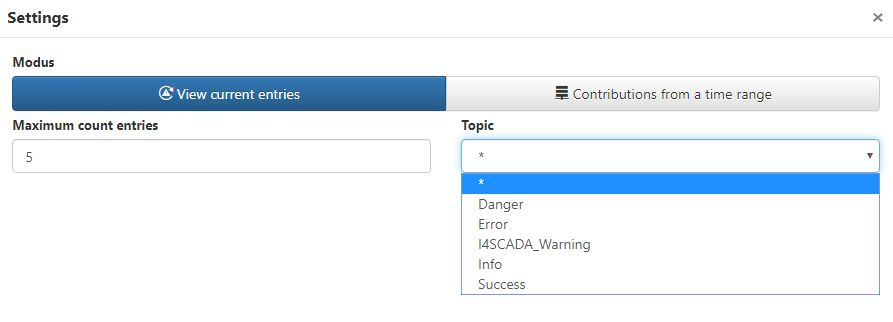
View current entries Mode
Maximum count entries - allows the user to apply a maximum amount of entries that will be displayed by the Logbook table.
Note
In case the Logbook displays a total of 20 entries and the Maximum count entries setting is set to value 5, only the last chronological entries will be displayed.
Topic - allows the user with possibility to filter the Logbook list by the message Topic. The Topic can be selected from the drop-down list items, based on the design-time collection.
Note
The asterisk * symbol can be used as a placeholder which stands for All items.
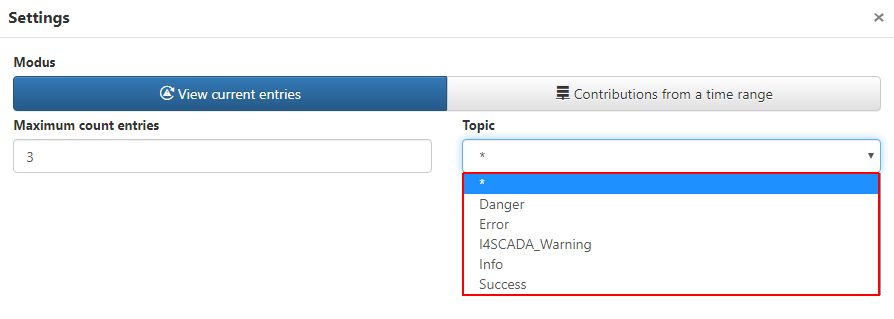
The Topic drop-down list
Enable the Contributions from a time range mode and apply additional settings:

Contributions from a time range Mode
Maximum count entries - allows the user to apply a maximum amount of entries that will be displayed by the Logbook table.
Note
In case the Logbook displays a total of 20 entries and the Maximum count entries setting is set to value 5, only the last chronological entries will be displayed.
Topic - allows the user to filter the Logbook list by the message Topic. The Topic can be selected from the drop-down list items, based on the design-time collection.
Note
The asterisk * symbol can be used as a placeholder which stands for All items.
Time range from - allows the user to apply a custom start date an time, using the Calendar selector.
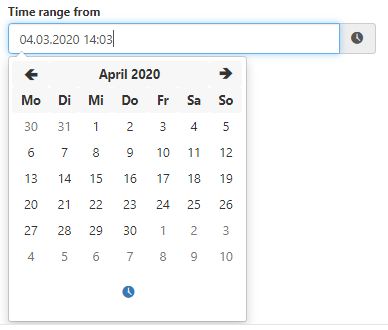
The "Time range from" selector
Time range to - allows the user to apply a custom end date and time, using the Calendar selector.
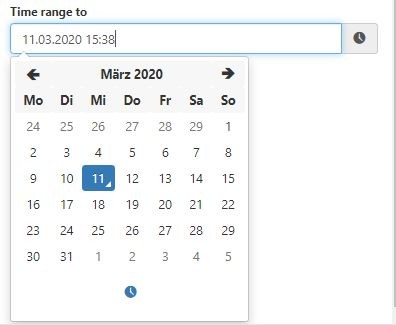
The "Time range to" selector
By clicking the Apply button, the defined settings will be applied to the Logbook. In order to leave the Settings section without processing any changes, the user can click the Cancel button.
The Send toolbar button opens a pop-up dialog where the user can define a new Logbook message, by filling in the following fields:
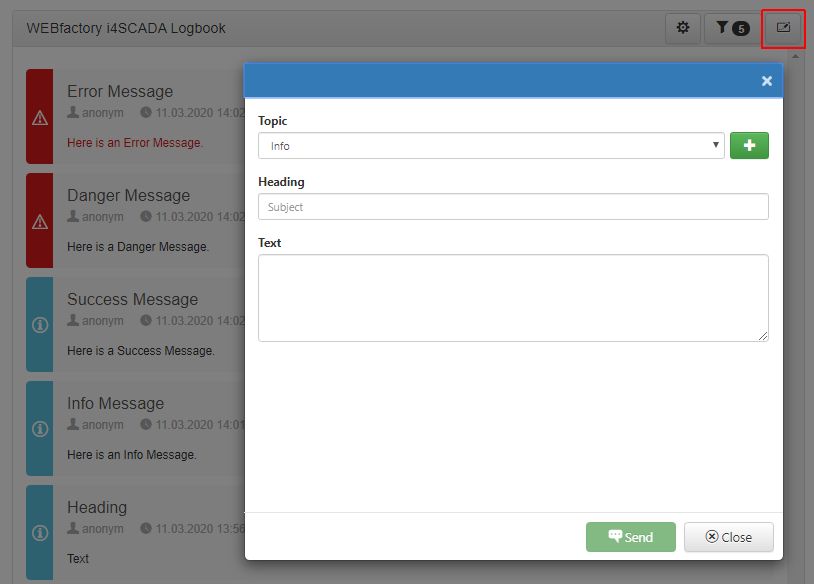
The Send toolbar button and dialog
Topic - applies the main topic of the log post, selecting from the drop-down list options.
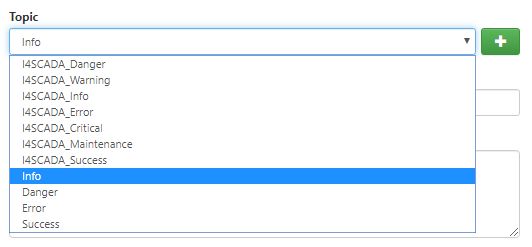
The Topic selector
Note
All the log posts written for a certain topic will be posted and listed under the specified topic.
The user can also add new topics, at run-time, by clicking the + button. This selection will enable a free text field where the user can type in the Topic name .

Creating a new Topic
Heading - stands for the log post subject. As this is a free text field, the user can write any information here.
Text - stats for the actual log post message. As this a free text field, the user can write any information here.
In order to deliver the message to the Logbook the user can click the Send button. Otherwise, the Close button will close the dialogue without preserving any changes.
The list of Logs displays the actual content view of the Logbook extension. Each Log is displayed as a card in a scrollable list providing the following information:

The Log card example
the Log post subject
the name of the user that posted the Log
the date when the Log was posted
the Log post
the Log Topic label
the Log Topic icon