SmartEditor Historical Data tutorials
If you are planning to design a Historical Data project, check out these articles and learn more details about the settings required for achieving your goal.
Note
Prerequisites for these guides:
i4scada 3.8.7 running the demo project
i4scada SmartEditor
Setting up a Historical Data project
Check out this article and learn how to design your Historical Data project, from scratch. Should be easy if you follow the steps described here.
To design and publish a simple Historical Data project, follow the steps below:
Note
The present demonstration will use the "Temperature 1" and "Temperature 2" in the default Ewon by HMS Networksi4scada Demo project.
Open the i4scada SmartEditor with Administrative privileges.
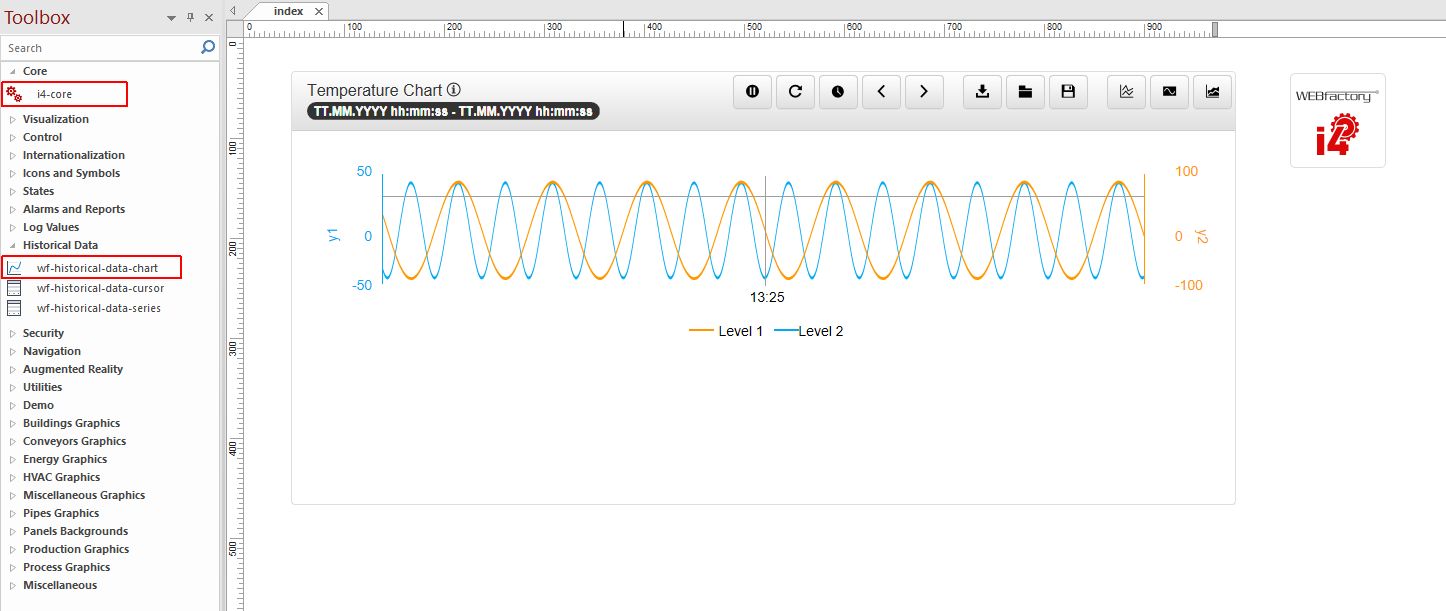
A new project is opened and ready to use. Go to the Toolbox panel and add the i4-core extension to your project page.
Return to the Toolbox panel and add the wf-historical-data-chart extension to your project page.
Visit the Object Properties panel of the wf-historical-data-chart extension and fill in the following general configuration settings:
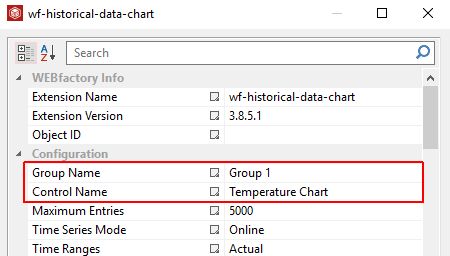
Fill in the Group Name property, adding the name of the group containing the Signals to be added as data series to the chart.
Fill in the Control Name, that will be used as namespace for the serial chart provider.
Start adding the data series under the collection property Series Configuration.
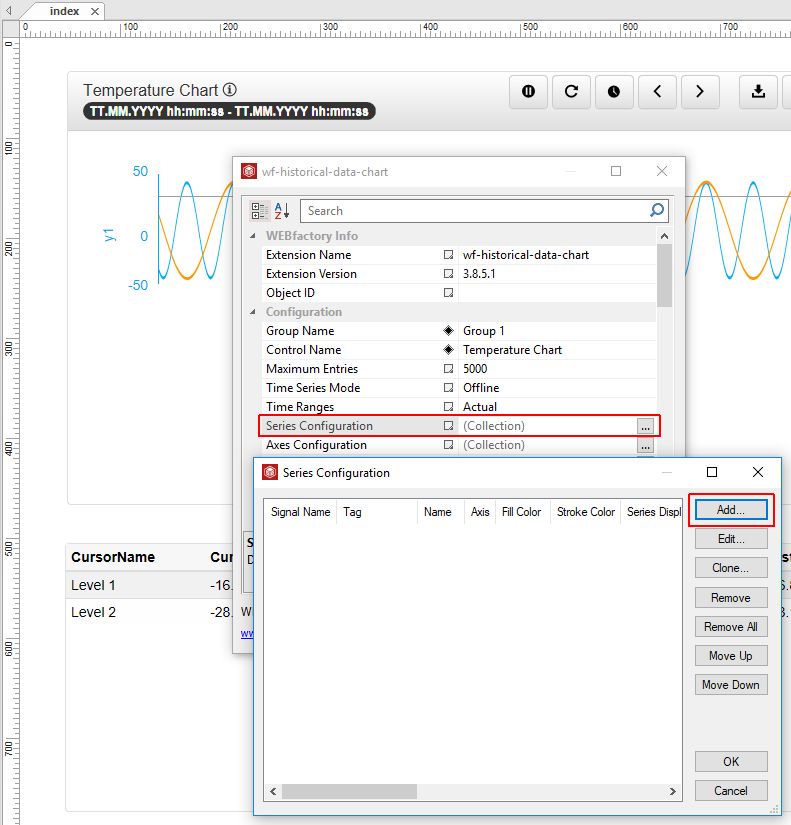
By clicking the Add button of the Series Configuration panel, the Edit Item window is opened, allowing to configure the data series, as follows:
Add the Signal Name to be used as data series for the Historical Data project.
Add the Log Tag name used by the previously added Signal.
Add the Name corresponding to the data series.
Select the Axis on which the data series will be plotted at run-time.
Configure the layout and appearance properties of the data series, as desired.
Optionally, fill in Horizontal lines as described in the Historical Data Chart article .
If Cursors are also needed, fill in the Cursors property as described in the Historical Data Chart article.
Preserve the settings by clicking the OK button until the Object Properties panel is closed.
Next, add the wf-historical-data-cursor extension on the project page.
Open the Object Properties panel of the wf-historical-data-cursor extension and organise the following settings:
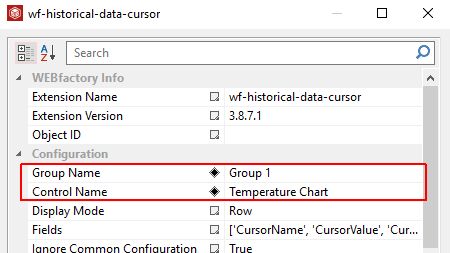
Fill in the Group Name property, adding the name of the group containing the Signals to be added as data series to the chart.
Fill in the Control Name, that will be used as namespace for the serial chart provider.
Preserve the changes by clicking the OK button of the Object Properties panel.
Add the wf-historical-data-series extension on the project page.
Open the Object Properties panel of the wf-historical-data-series extension and organise the following settings:
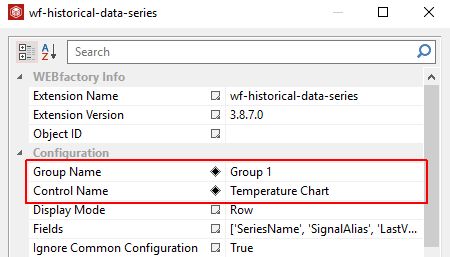
Fill in the Group Name property, adding the name of the group containing the Signals to be added as data series to the chart.
Fill in the Control Name, that will be used as namespace for the serial chart provider.
Preserve the changes by clicking the OK button of the Object Properties panel.
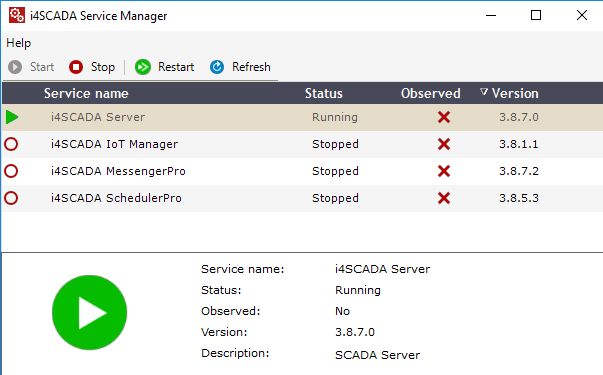
Open the i4scada Service Manager and start the i4scada Server.
Return to the i4scada SmartEditor and press the toolbar button Publish.
The HTML output is generated and published.
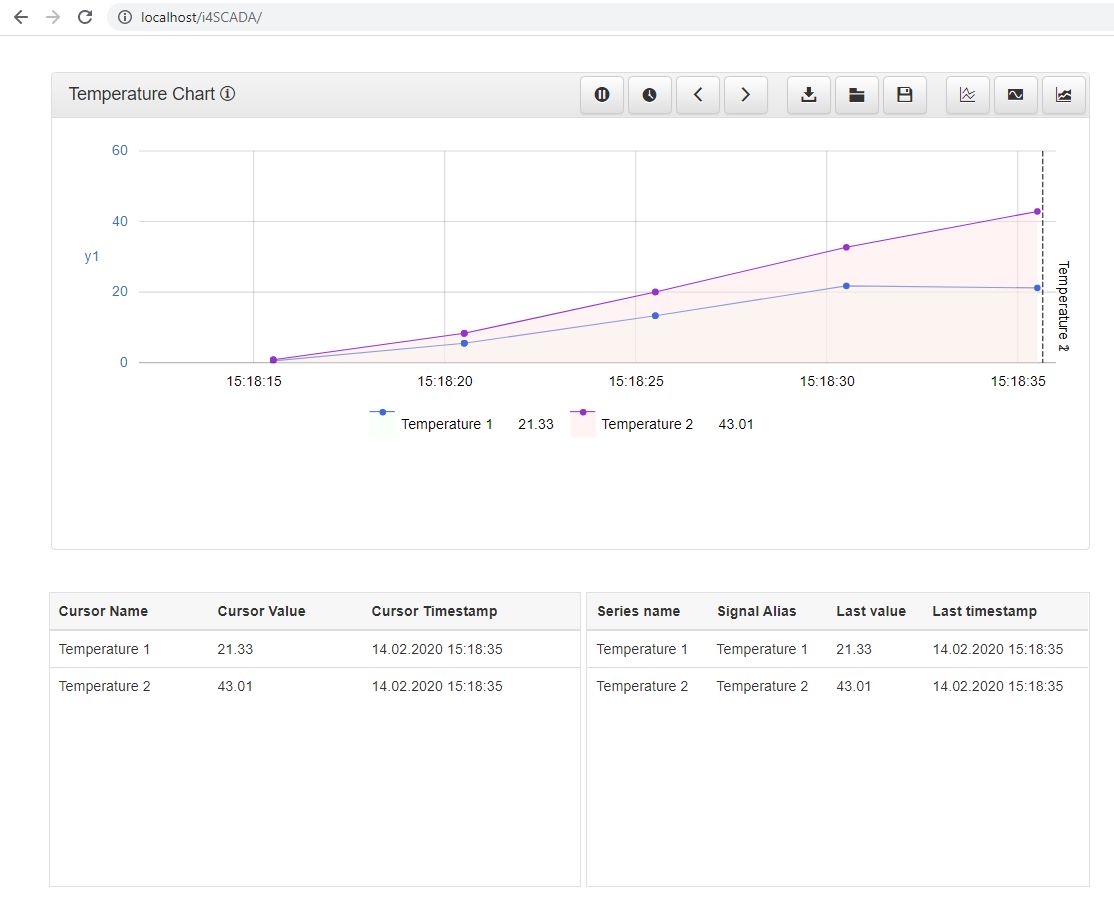
Open the published website.
The Historical Data project can be further managed at run-time as described in the Historical Data at run-time articles.