Custom Scripts Debug
This article will demonstrate how to debug your own scripts in your i4scada App Template project using the Dev Tools on Google Chrome.
When building an application using the i4scada App Template tracing the root of the errors that might appear in your custom JavaScript scripts might be harder than anticipated. This article will demonstrate how to debug your own scripts in your i4scada App Template project using Google Chrome's Dev Tools.
Example script debugging
In this example application, we have included a custom JavaScript script that will transform temperatures from Celsius to Fahrenheit and back. The script is bundled in the application using the standard procedure (Gulp script bundle) and a custom view, view model, and route have been defined for demonstrative purposes.
While running the application inside the web browser, the custom script can be accessed using the built-in development tools. We recommend using Google's Chrome browser for debugging your applications.

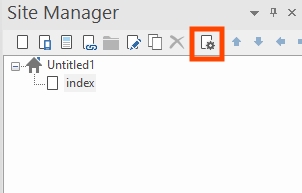
Page Properties button
To view and debug your custom script, open the Dev Tools by pressing F12 in the browser's window. By default, the Dev Tools panel will display the Elements tab. To view your script, select the Sources tab from the Dev Tools top menu.

Dev Tools panel
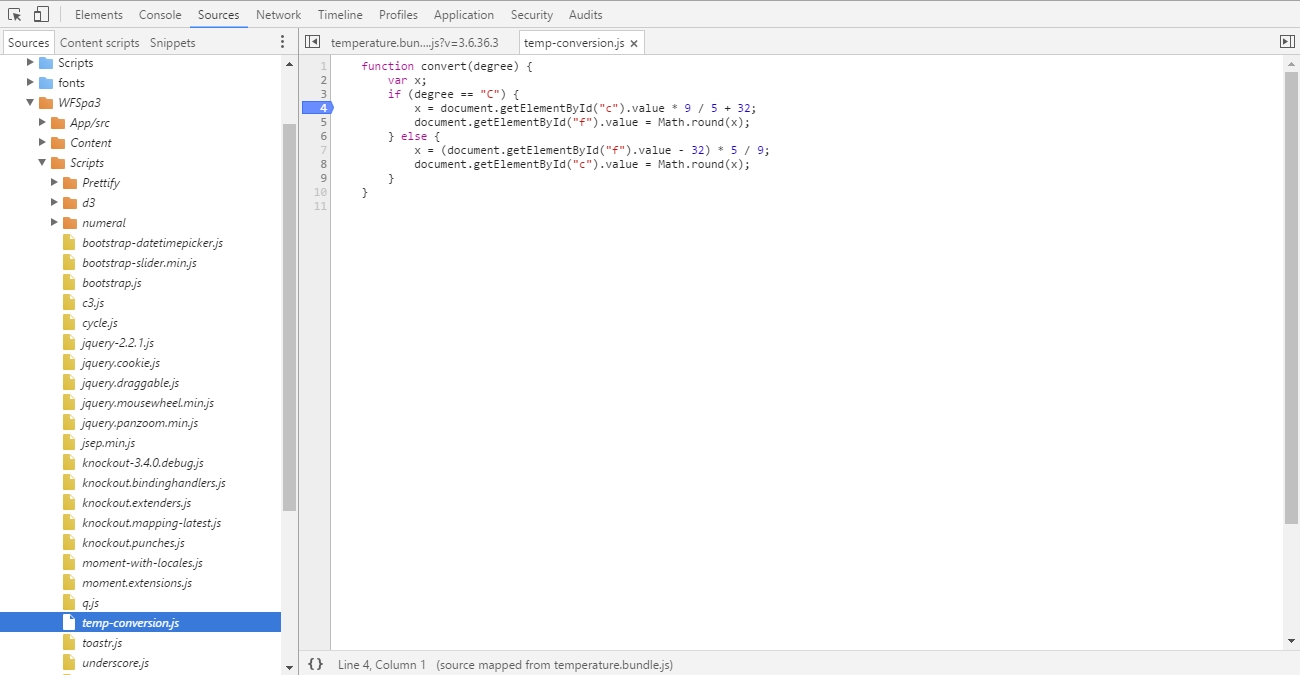
Using the left-side tree menu, you can navigate your application sources. The Scripts file will contain all script bundles built by Gulp. These bundles are great for production but they don't provide a good debugging environment since all the scripts are combined into vendor bundle scripts which are loaded by the application.

Dev tools - Script Bundles
Fortunately, the application provides source maps for all the included scripts, and the browser will detect that and inform you. This means that you can view and debug your JavaScript scripts just as you would in the editor. For this, you need to access your script using the structure provided by the Dev Tools in the tree menu and navigate to your desired script.

Dev tools - Script Bundles
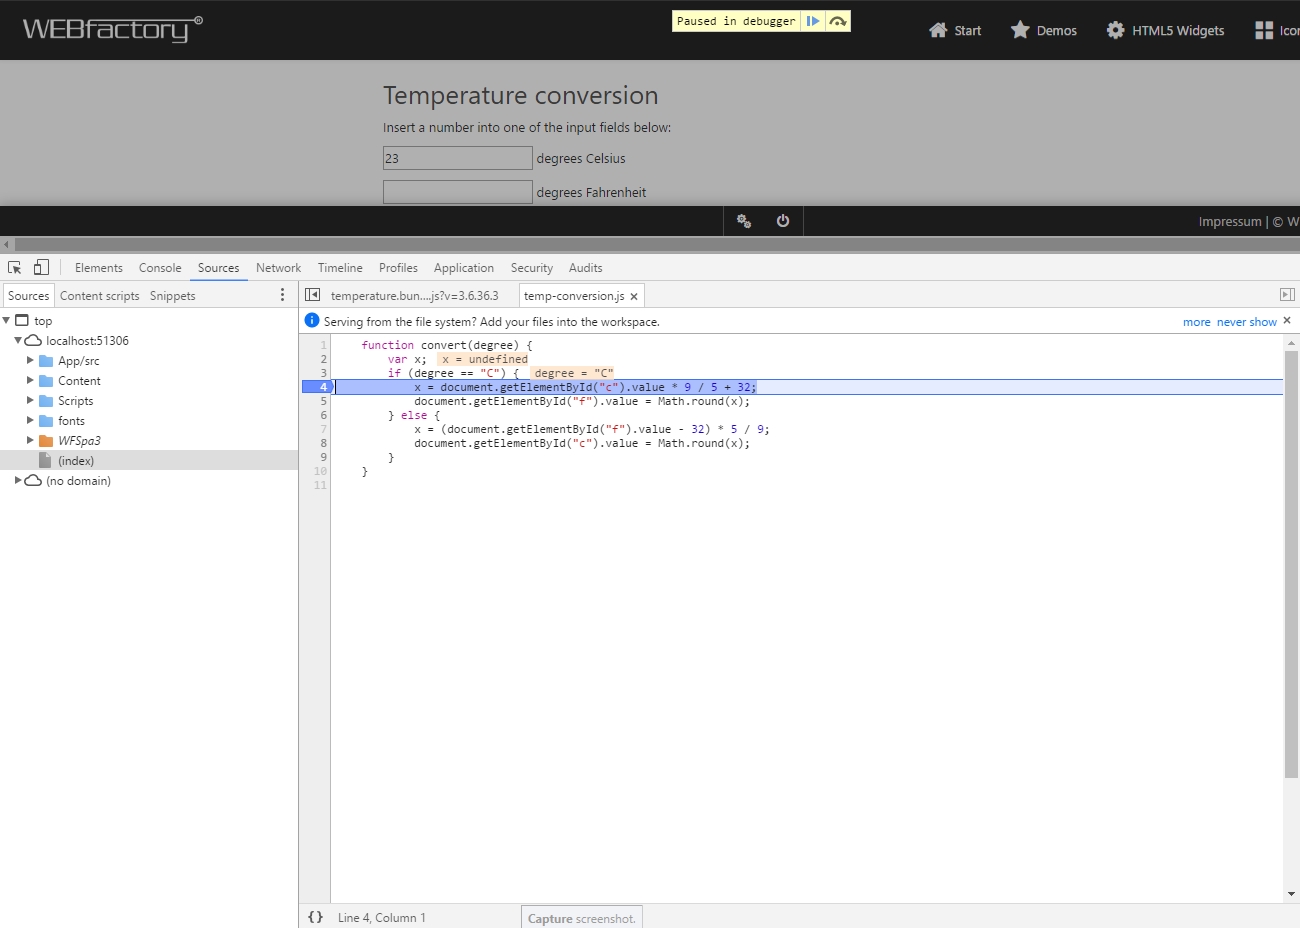
Here, you can use breakpoints to navigate through your script's logic and debug your script, just like in a specialized IDE.

Scripted breakpoints