Historical Data at design-time
Check out this article in order to learn more details on how to configure the i4scada SmartEditor Historical Data extensions.
The i4scada SmartEditor extensions for Historical Data management are available in the toolbox panel under the Historical Data category.
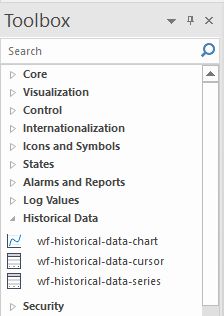
The Historical Data extensions
The wf-historical-data-chart extension
The trend chart component provides a visual chart view over the data provided by a time series data provider. Check out this article for more details.
The i4scada SmartEditor wf-historical-data-chart extension provides a visual chart view over the data provided by a set of time series.
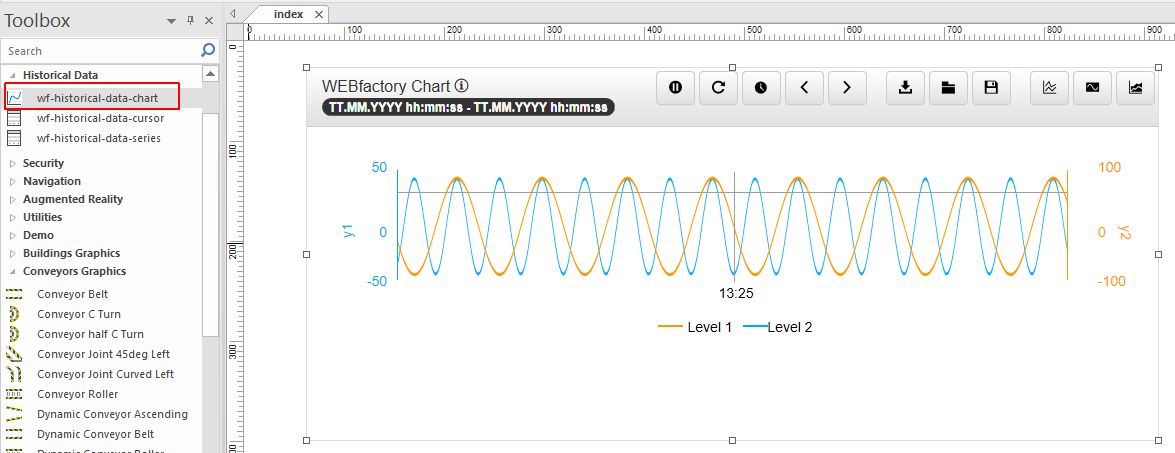
The wf-historical-data-chart extension
The wf-historical-data-chart extension is available in the SmartEditor Toolbox panel, under the Historical Data category. At design time the user can customise the extension layout, colours, appearance, security and configuration settings, as follows:
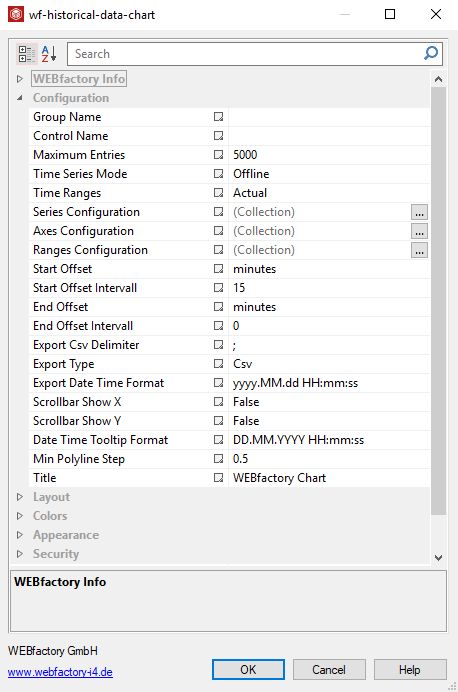
The Object Properties panel
Category | Object property | Description |
|---|---|---|
WEBfactory Info | Extension name | The name of the extension as defined in the i4scada SmartEditor: "wf-historical-data-chart". |
Extension Version | The WEBfactory extension number. | |
Object ID | Optional helper property. The value of the Object ID can be used via a placeholder [OID] in other properties of this extension. Example: Signal name "Setpoint [OID]" The placeholder is supported in all signal properties, symbolic texts and states. | |
Configuration | Group Name | Allows the user to optionally define a Group for the serial provider. It should match with the i4scada Studio Signal Group name. |
Control Name | Allows the user to define the unique namespace for the serial chart provider. The value of the Control Name property will be reusable in different contexts, as described in the upcoming articles. | |
Maximum entries | Allows the user to define the maximum amount of entries supported by the chart. | |
Time Series Mode | Allows the user to define the time series mode, selecting from the drop-down list options:
| |
Time Ranges | Allows the user to define the time range to be displayed, selecting from the drop-down list options: Actual, Custom, Day, Month, Today, Week, Year or Yesterday. | |
Series Configuration | Allows the user to open the Series configuration dialog in order to define the chart series. The Series Configuration dialog features the commonly met options: Add, Edit, Clone, Remove, Remove All, Move Up and Move Down. The chart series feature the following configurable options:
| |
Axes Configuration | Allows the user to open the Axes Configuration panel in order to configure the chart axes. The Axes Configuration dialog features the commonly met options: Add, Edit, Clone, Remove, Remove All, Move Up and Move Down. In order to configure the multiple chart axes or edit the existing ones, the user is needs to organise the following settings:
| |
Range Configuration | Allows the user to open the Ranges Configuration dialog, where the chart regions can be defined. In this dialog, the user can configure a collection of regions to indicate important areas of the graph. Each region can be configured with the following options:
| |
Start Offset | Allows the user to select the start offset used to load historical data. The user can select from the drop-down list options: hours, seconds, minutes, months, weeks or years. | |
Start Offset Interval | Allows the user to set a numerical value for the start offset property. The specified offset interval is taken from the current time, constantly updating the length of the window. | |
End Offset | Allows the user to select the end offset used to load historical data. The user can select from the drop-down list options: hours, seconds, minutes, months, weeks or years. | |
End Offset Interval | allows the user to set a numerical value for the end offset property. The specified offset interval is taken from the current time, constantly updating the length of the window. | |
Export Csv Delimiter | Defines the delimiter of the columns, in the export file. | |
Export Type | Defines the format in which the historical chart should be exported, allowing the user to chose between the drop-down list options: CSV, Excel, JSON or XML. | |
Export Date Time Format | Defines the export file date time format. Available formats can be found under the Custom date and time format strings article. | |
Scrollbar Show X | Defines whether the scrollbar for the X-axis is displayed. | |
Scrollbar Show Y | Defines whether the scrollbar for the Y-axes is displayed. | |
Date Time Tooltip Format | Defines the format of the date time in the chart tooltip and badge. Available tokens are - YYYY, YY, Y, Q, MM, MMM, MMMM, D, DD. Further information are available under the Year, month and day tokens article. | |
Min Polyline Step | When multi-segment lines (Polylines) are drawn, some points may be simplified if they are closer than the Min Polyline Step. The bigger this value, the more simplified lines come out. | |
Title | Sets the text tile of the chart. The Chart title will not be translated at run-time. | |
Layout | Height | Sets the chart height, expressed in pixels. |
Dialog Toolbox Show Labels | Defines whether the toolbox for displaying the configuration dialog buttons should be displayed. | |
Data Toolbox Show Labels | Defines whether the toolbox for displaying the data configuration buttons should be displayed. | |
Show Legend | Enables the display of the legend, by setting property to True. | |
Show Legend Values | Enables the display of Legend values, by setting property to True. | |
Legend Position | Allows the user with possibility to set the position of the chart Legend, selecting from the drop-down list options: bottom, left, right or top. | |
Legend Vertical Align | Allows the user with possibility to set the chart Legend alignment, selecting from the drop-down list options: bottom, middle, none or top. | |
Show Date Time Tooltip | Allows the user with possibility to set the contents of the chart legend alignment, selecting from the drop-down list options: centre, none, right or top. | |
Layout Vertical | Changes the orientation of the axes, the axes have two containers in which they can be placed (left or right). The containers can change their behavior between side-by-side or one-on-top-of-each-other. If the property is set to True all axes are displayed one above the other. | |
Colors | Custom Header Color | Sets a custom color for the header bar. For the changes to be applied "panel-custom" panel style must be selected. |
Custom Title Color | Sets a custom color for the panel title text. For the changes to be applied "panel-custom" panel style must be selected. | |
Custom Butons Color | Sets a custom background color for the buttons. For the changes to be applied "panel-custom" panel style must be selected. | |
Custom Buttons Foreground | Sets a custom foreground color for the buttons icon. For the changes to be applied "panel-custom" panel style must be selected. | |
Appearance | Panel Style | The style of the panel encapsulating the extension. Can be panel-danger, panel-default, panel-info, panel-primary, panel-success, panel-warning or panel-custom. |
Panel Bar Css Class | The style of the extension panel bar. Can be panel-danger, panel-default, panel-info, panel-primary, panel-success, panel-warning or panel-custom. | |
Button Bar Css Class | The style of the buttons displayed on the panel bar. Can be panel-danger, panel-default, panel-info, panel-primary, panel-success, panel-warning or panel-custom. | |
Font Family | Sets the font family of the extension textual information. | |
Custom CSS | Allows the insertion of a custom CSS code that can be used to add additional styling to the extension. | |
Security | Visibility Signal Name | The name of the signal which is used to hide the extension. |
Visibility Operator | Allows selection of the operator for the condition of the extension. Available options are: !=, ==, >=, <=, <, >. | |
Visibility Signal Value | Sets the value of the Signal name set at Visibility Signal Name property, allowing the system to compare this value, against the Visibility Signal, using the Visibility Operator, as follows: [Signal] [operator] [value], where:
| |
Project Authorization | The Project Authorization required for the user to have, in order to see the extension at run-time. The extension will be shown by default if property is not set. | |
System Authorization | The System Authorization required for the user to have, in order to see the extension at run-time. The extension will be shown by default if property is not set. | |
Initial Configuration | The name of the chart configuration to be loaded by default. It is mandatory that the respective configuration exists, otherwise the chart display will be as per default defined. | |
Configuration Namespace | The namespace for the preferred configuration saved at run-time. | |
Configuration Name | Defines a default name for the configuration to be saved at run-time. | |
Clientside Configuration | Defines whether configurations are saved locally. |
The wf-historical-data-cursor extension
The cursor details component showing cursor information configured inside a set of time series. For more details check out this article.
The i4scada SmartEditor wf-historical-data-cursor extension is a lightweight component which can display information regarding the data cursor, inside a time-series provider.

The wf-historical-data-cursor extension
The wf-historical-data-cursor extension is available in the SmartEditor Toolbox panel, under the Historical Data category. At design time, the user can set the extension appearance, security and configuration settings as follows:
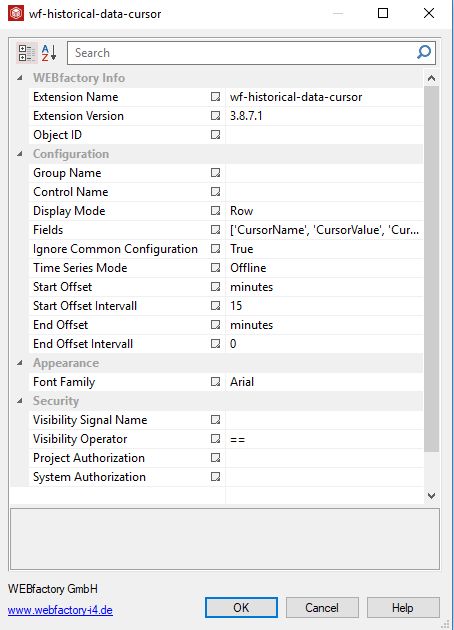
The Object Properties panel
Category | Object Property | Description |
|---|---|---|
WEBfactory Info | Extension Name | The name of the extension as defined in the i4scada SmartEditor: "wf-historical-data-cursor |
Extension Version | The WEBfactory extension number. | |
Object ID | Optional helper property. The value of the Object ID can be used via a placeholder [OID] in other properties of this extension. Example: Signal name "Setpoint [OID]" The placeholder is supported in all signal properties, symbolic texts and states. | |
Configuration | Group Name | Allows the user to optionally define a Group namespace for the serial provider. It should match with the i4scada Studio Signal Group name. |
Control Name | Allows the user to define the unique namespace for the serial chart provider. The value of the Control Name property will be reusable in different contexts, as described in the upcoming articles. | |
Display Name | Allows the user to select the desired display mode, selecting from the drop-down list options:
| |
Fields | Allows the user to define which fields are displayed by the extension. The supported entries are: CursorsName, CursorsValue, CursorsTimestamp. TipThe wf-historical-data-series fields need to be added between quotation marks and square brackets. For example: ['CursorsName', 'CursorsValue', 'CursorsTimestamp'] | |
Ignore Common Configuration | Allows the user to configure if the new configuration will ignore the common configuration, hence the configuration will not be overwritten on subscription, by setting property to "True". | |
Time Series Mode | Allows the user to define the time series mode, selecting from the drop-down list options:
| |
Start Offset | Allows the user to select the start offset used to load historical data. The user can select from the drop-down list options: hours, seconds, minutes, months, weeks, years. | |
Start Offset Interval | Allows the user to set a numerical value for the start offset property. | |
End Offset | Allows the user to select the end offset used to load historical data. The user can select from the drop-down list options: hours, seconds, minutes, months, weeks, years. | |
End Offset Interval | Allows the user to set a numerical value for the end offset property. | |
Appearance | Font Family | Sets the font family of the extension textual information. |
Security | Visibility Signal Name | The name of the signal which is used to hide the extension. |
Visibility Operator | Allows selection of the operator for the condition of the extension. Available options are: !=, ==, <=, >=, <, >. | |
Visibility Signal Value | Sets the value of the Signal name set at Visibility Signal Name property, allowing the system to compare this value, against the Visibility Signal, using the Visibility Operator, as follows: [Signal] [operator] [value], where:
| |
Project Authorization | The Project Authorization required for the user to have, in order to see the extension at run-time. The extension will be shown by default if property is not set. | |
System Authorization | The System Authorization required for the user to have, in order to see the extension at run-time. The extension will be shown by default if property is not set. |
The wf-historical-data-series extension
The series details component is a lightweight component which can display information regarding the data series configured inside a time series provider.
The i4scada SmartEditor wf-historical-data-series extension is a lightweight component which can display information regarding the data series configured inside a time series provider.
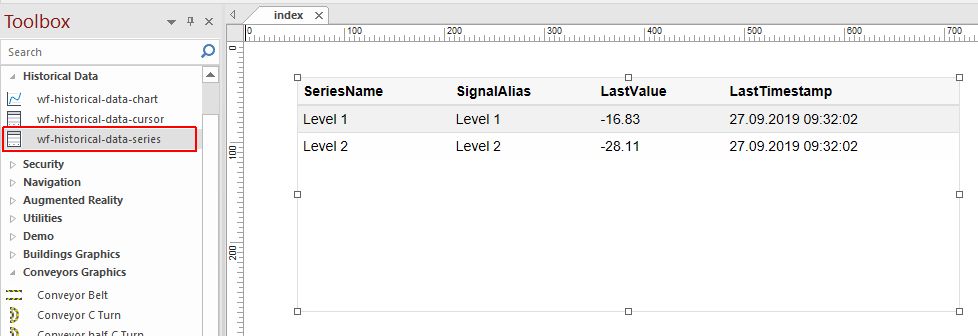
The wf-historical-data-series extension
The wf-historical-data-series extension is available in the SmartEditor Toolbox panel, under the Historical Data category. At design time, the user can set the extension appearance, security and configuration settings as follows:
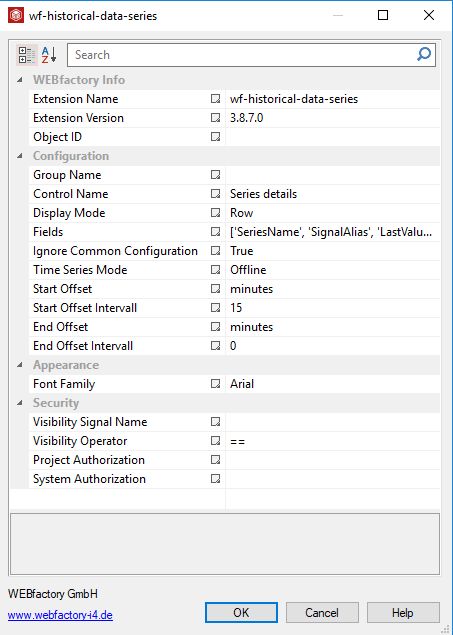
The Object Properties of the wf-historical-data-series extension
Category | Object Property | Description |
|---|---|---|
WEBfactory Info | Extension Name | The name of the extension as defined in the i4scada SmartEditor: "wf-historical-data-cursor |
Extension Version | The WEBfactory extension number. | |
Object ID | Optional helper property. The value of the Object ID can be used via a placeholder [OID] in other properties of this extension. Example: Signal name "Setpoint [OID]" The placeholder is supported in all signal properties, symbolic texts and states. | |
Configuration | Group Name | Allows the user to optionally define a Group namespace for the serial provider. It should match with the i4scada Studio Signal Group name. |
Control Name | Allows the user to define the unique namespace for the serial chart provider. The value of the Control Name property will be reusable in different contexts, as described in the upcoming articles. | |
Display Name | Allows the user to select the desired display mode, selecting from the drop-down list options:
| |
Fields | Allows the user to define which fields are displayed by the extension. The supported entries are: SeriesName, SignalName (the series name(s) need to be unique), SignalAlias, SignalDescription, SignalMin, SignalMax, SeriesAvg, Unit, LastValue, LastTimestamp. TipThe wf-historical-data-series fields need to be added between quotation marks and square brackets. For example: ['SeriesName', 'SignalAlias', 'LastValue', 'LastTimestamp']. | |
Ignore Common Configuration | Allows the user to configure if the new configuration will ignore the common configuration, hence the configuration will not be overwritten on subscription, by setting property to "True". | |
Time Series Mode | Allows the user to define the time series mode, selecting from the drop-down list options:
| |
Start Offset | Allows the user to select the start offset used to load historical data. The user can select from the drop-down list options: hours, seconds, minutes, months, weeks, years. | |
Start Offset Interval | Allows the user to set a numerical value for the start offset property. | |
End Offset | Allows the user to select the end offset used to load historical data. The user can select from the drop-down list options: hours, seconds, minutes, months, weeks, years. | |
End Offset Interval | Allows the user to set a numerical value for the end offset property. | |
Appearance | Font Family | Sets the font family of the extension textual information. |
Security | Visibility Signal Name | The name of the signal which is used to hide the extension. |
Visibility Operator | Allows selection of the operator for the condition of the extension. Available options are: !=, ==, <=, >=, <, >. | |
Visibility Signal Value | Sets the value of the Signal name set at Visibility Signal Name property, allowing the system to compare this value, against the Visibility Signal, using the Visibility Operator, as follows: [Signal] [operator] [value], where:
| |
Project Authorization | The Project Authorization required for the user to have, in order to see the extension at run-time. The extension will be shown by default if property is not set. | |
System Authorization | The System Authorization required for the user to have, in order to see the extension at run-time. The extension will be shown by default if property is not set. |