Setpoint Chart at run-time
Abstract
Check out this article and learn more details about the Setpoint chart extension and how you can manage it at run-time.
After preparing the Setpoint Chart extension, as described in the previous section, the i4scadaSmartEditor project is ready to be published.
At run-time, the component is represented as a simple chart, plotting online signal values, using chart lines.
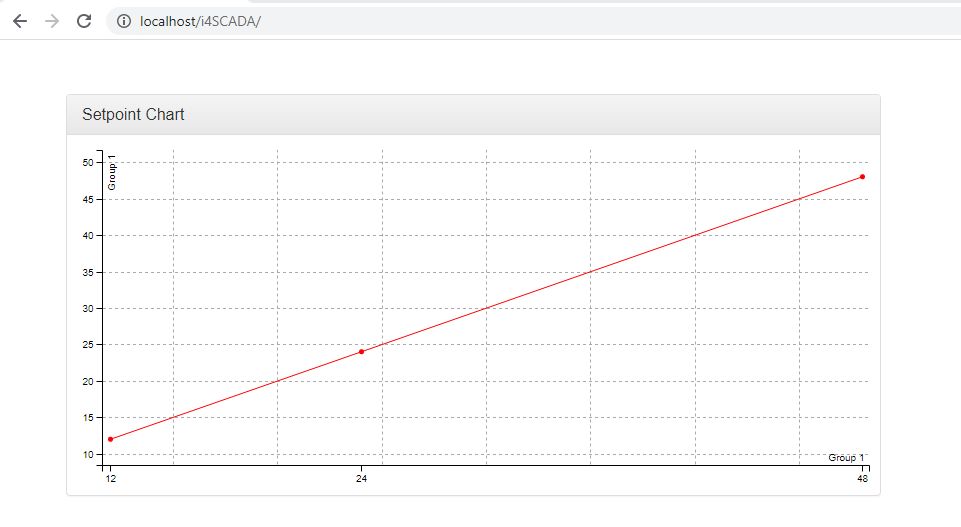
The run-time chart
The simple chart control does not provide any run-time configuration options, therefore all the design-time settings will be reflected in the project visualization.