Running the App Template and debugging
This article guides you through the needed steps to run and debug your i4scada Application Template.
Make sure that your working folder is in the IIS directory, before running the build task and open the application in a supported browser:
Open the Command Pallete, delete the angular bracket, type
task build, and press enter. The build progress will be listed in the Output panel.In the browser of choice, access the IIS folder hosting the application:
http://localhost/i4scada-app/.To use the debugger built in Visual Studio Code, the following steps must be performed:
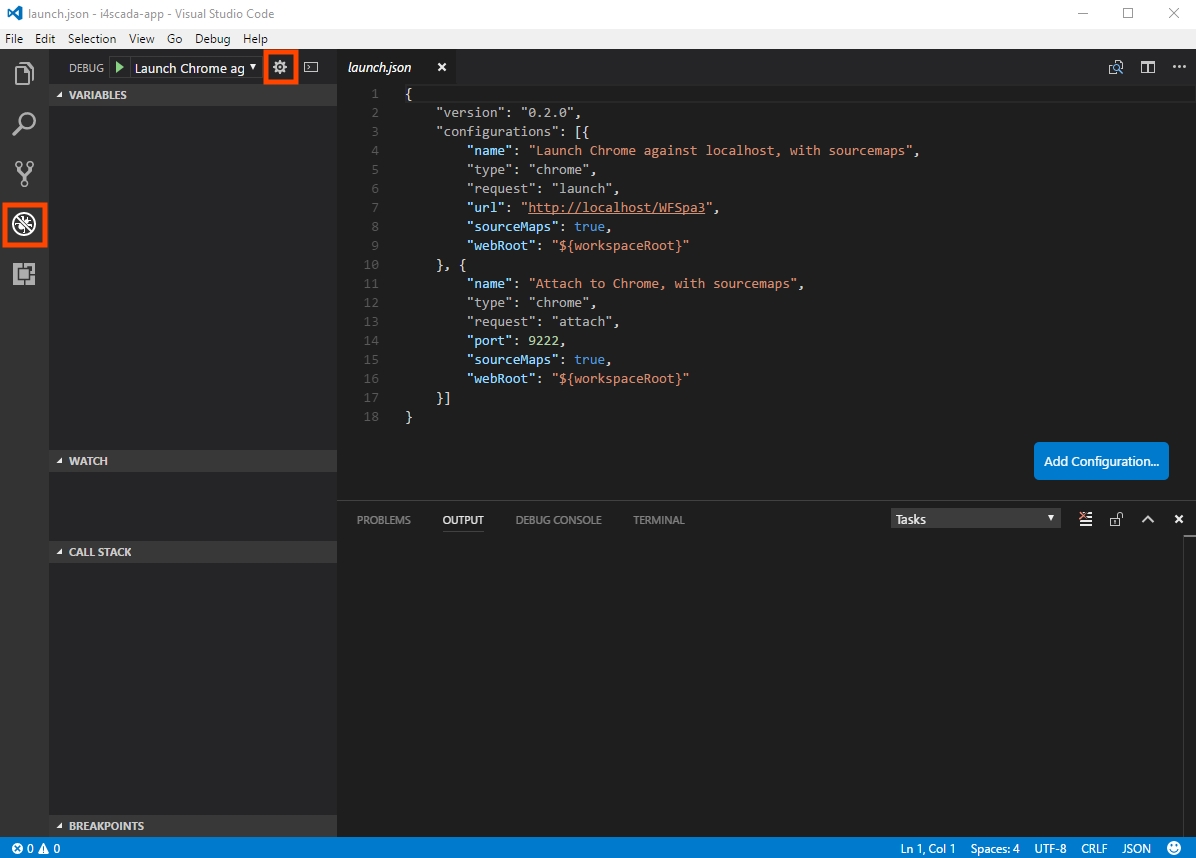
Click the Debug icon in the left-side menu of Visual Studio Code. In the Debug panel, click on the debug settings icon. This will open the launch.json file (C:\inetpub\wwwroot\i4scada-app\.vscode\launch.json), containing the settings required for debugging.

Debug option in Visual Studio Code
Make sure to specify the browser used for debugging and the URL of the application:
{
    "version": "0.2.0",
    "configurations": [{
        "name": "Launch Chrome against localhost, with sourcemaps",
        "type": "chrome",
        "request": "launch",
        "url": "http://localhost/i4scada-app",
        "sourceMaps": true,
        "webRoot": "${workspaceRoot}"
    }, {
        "name": "Attach to Chrome, with sourcemaps",
        "type": "chrome",
        "request": "attach",
        "port": 9222,
        "sourceMaps": true,
        "webRoot": "${workspaceRoot}"
    }]
}
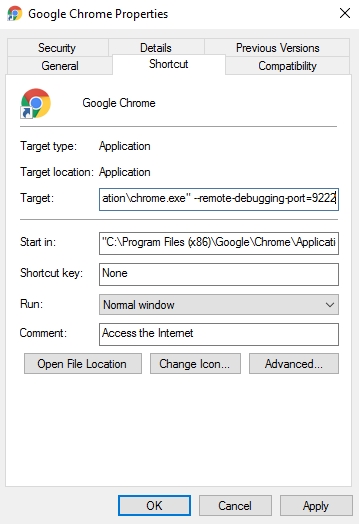
Next, the specified browser used for debugging must be tied to the Visual Studio Code debugger. To do this, locate the browser shortcut, right click on it and select Properties. In the Shortcut tab, place the cursor at the end of the Target text field and input the following parameter:
--remote-debugging-port=9222.
Define debugging parameters
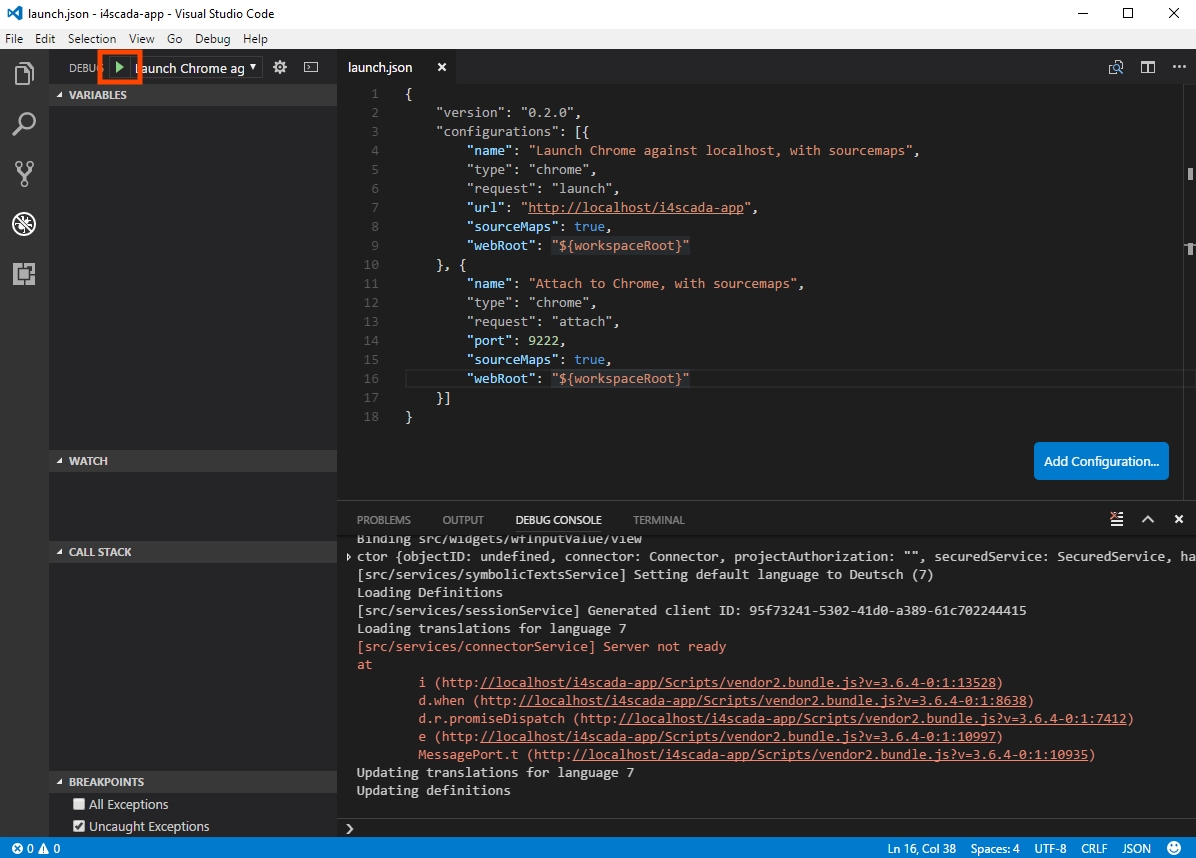
Now you can press the Start Debugging button (or F5 on the keyboard) to launch the application in the specified browser and start debugging.

Start Debugging