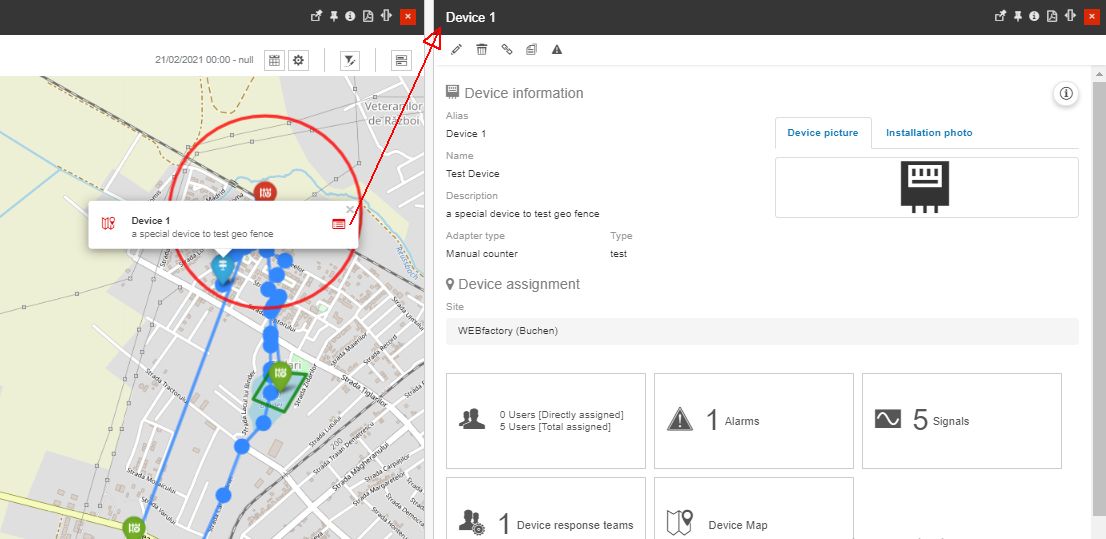
Device Map
Check out this article and learn more details about the Device Map panel and the options provided by it, to check device movements.
The Device Map panel can be accessed by clicking the Device Map tile, usually available on the administrative page.
Warning
This map reflects all the Geofences and GPS Tracking lines, generated for all Devices having the GPS Tracking features enabled. For more details on how to enable the GPS Tracking features, please also read the dedicated article, under the Edit devices article.
For a quick video guide, please also visit our YouTube channel.
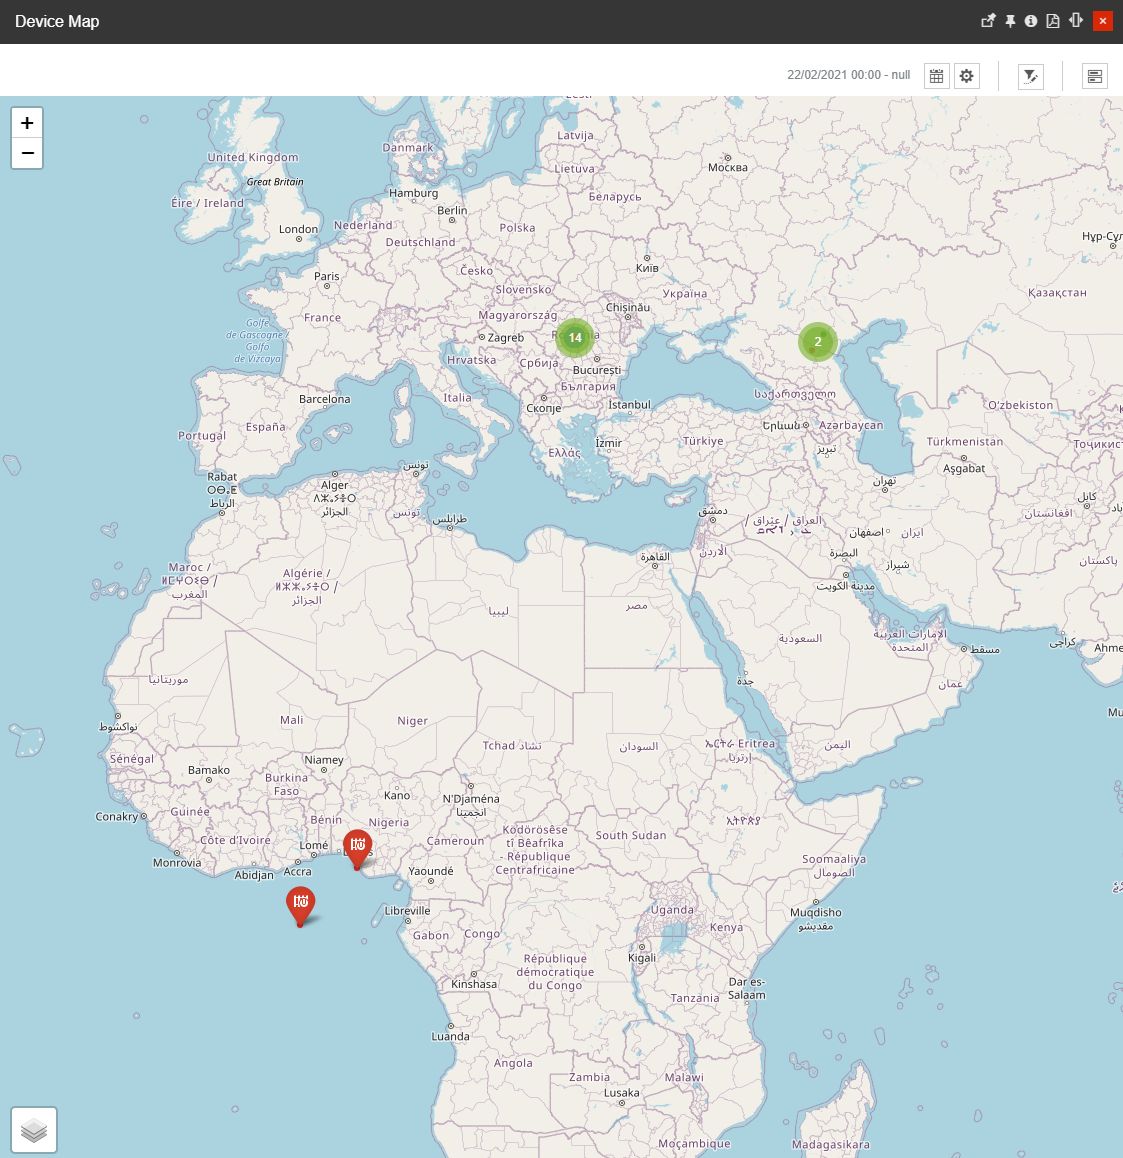
The Device Map panel
In this view, the user can visualize the GPS Tracking and Geofencing information, in a map view.
The toolbar of the Device Map panel features the following options:
the Calendar filter, allowing the user to pick specific time ranges and dates, using the designated pickers, and clicking the Apply button. As soon as the filter is applied, the map view is updated, to only display the GPS routes, contained within the selected time frame.

Note
The Time range and Calendar selectors are used to filter GPS routes, shown on the map.
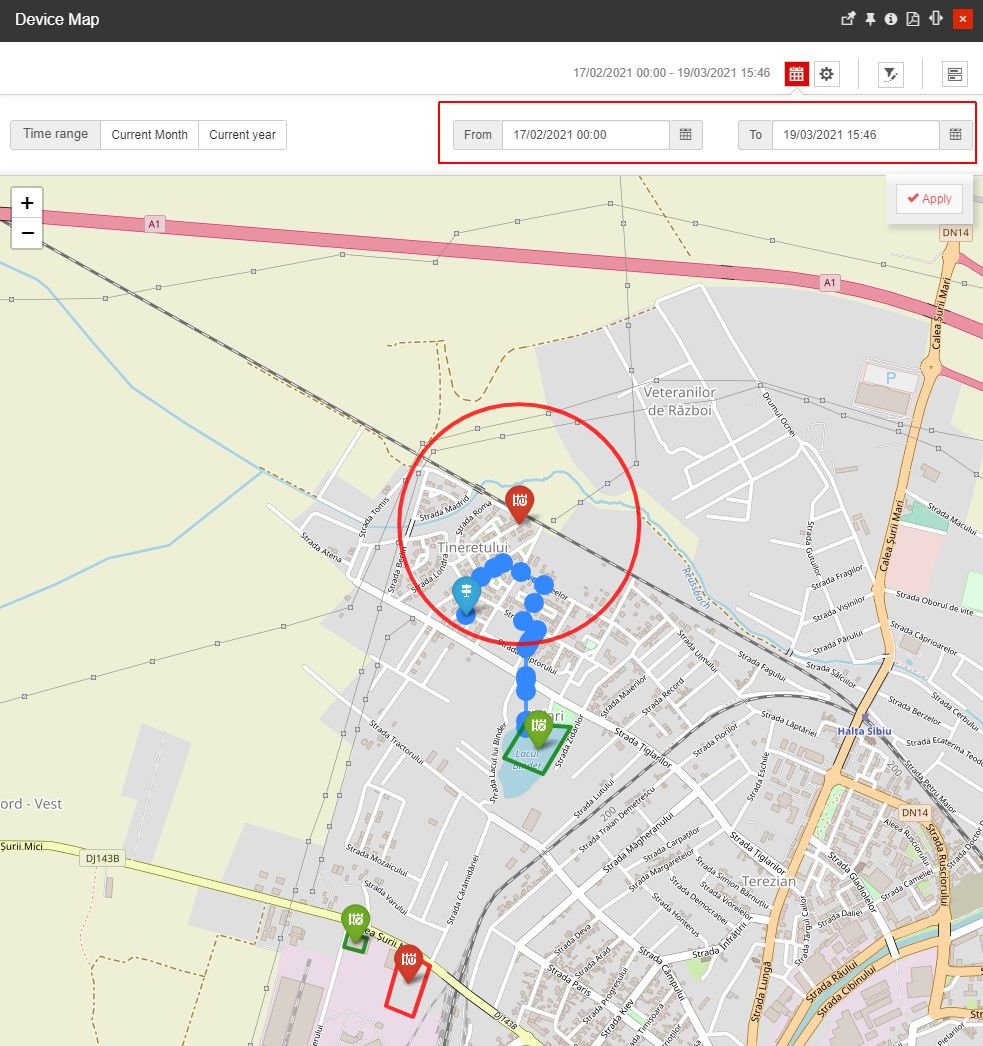
Time-frame filters applied
the Transmission settings selector, allowing the user to decide which layers to be applied on the map view, by choosing from the following options or a combination of those:

GPS routes - displays all the registered Device movements. GPS routes are represented on the map, using the Blue color.
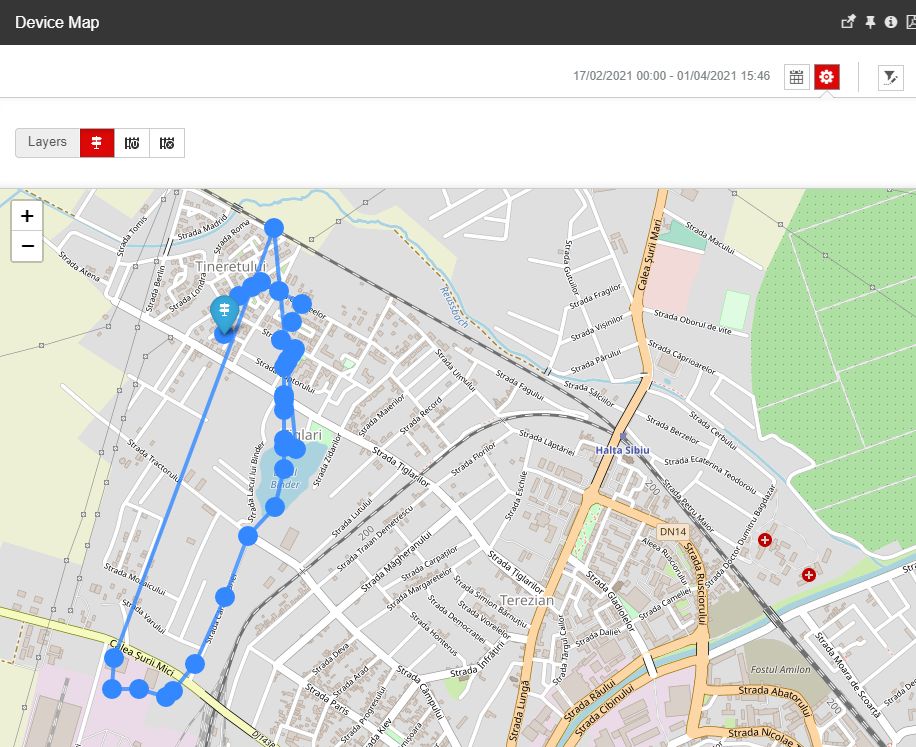
GPS Routes layer enabled
Tip
GPS routes are added automatically on the map view, based on registered Device movements.
Trigger fences - displays all the Device's fences, having the behavior set to "Trigger". The Trigger fences are represented on the map, using the Red color.
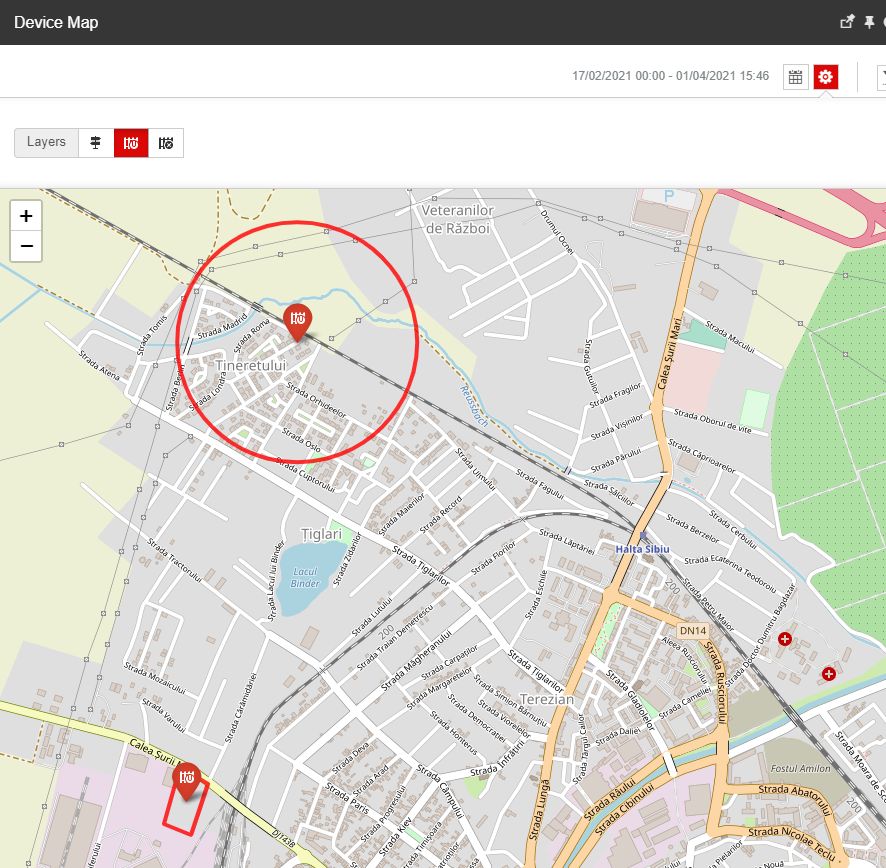
Trigger fences layer enabled
Suppress fences - displays all the Device's fences, having the behavior set to "Suppress". The Suppress fences are represented on the map, using the Green color.
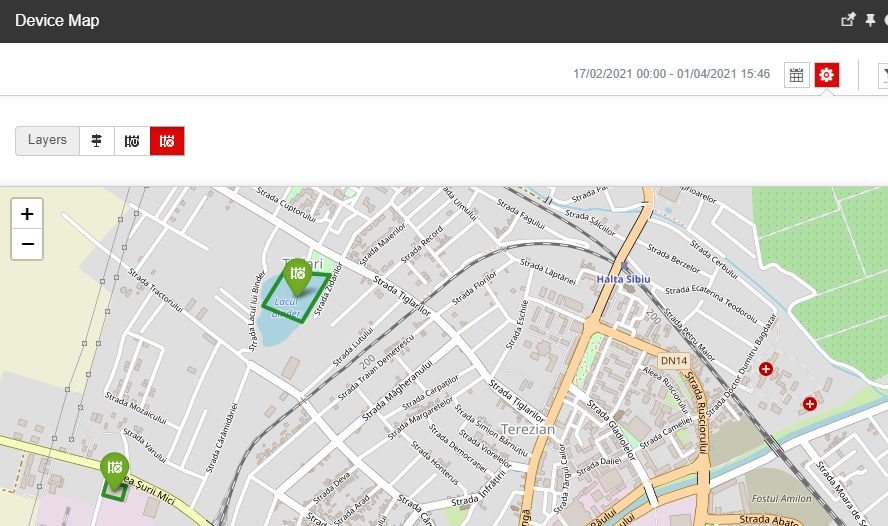
Suppress fences layer enabled
the Open filter selector, allowing the user to apply various entity-based filters, for the fences displayed on the map.
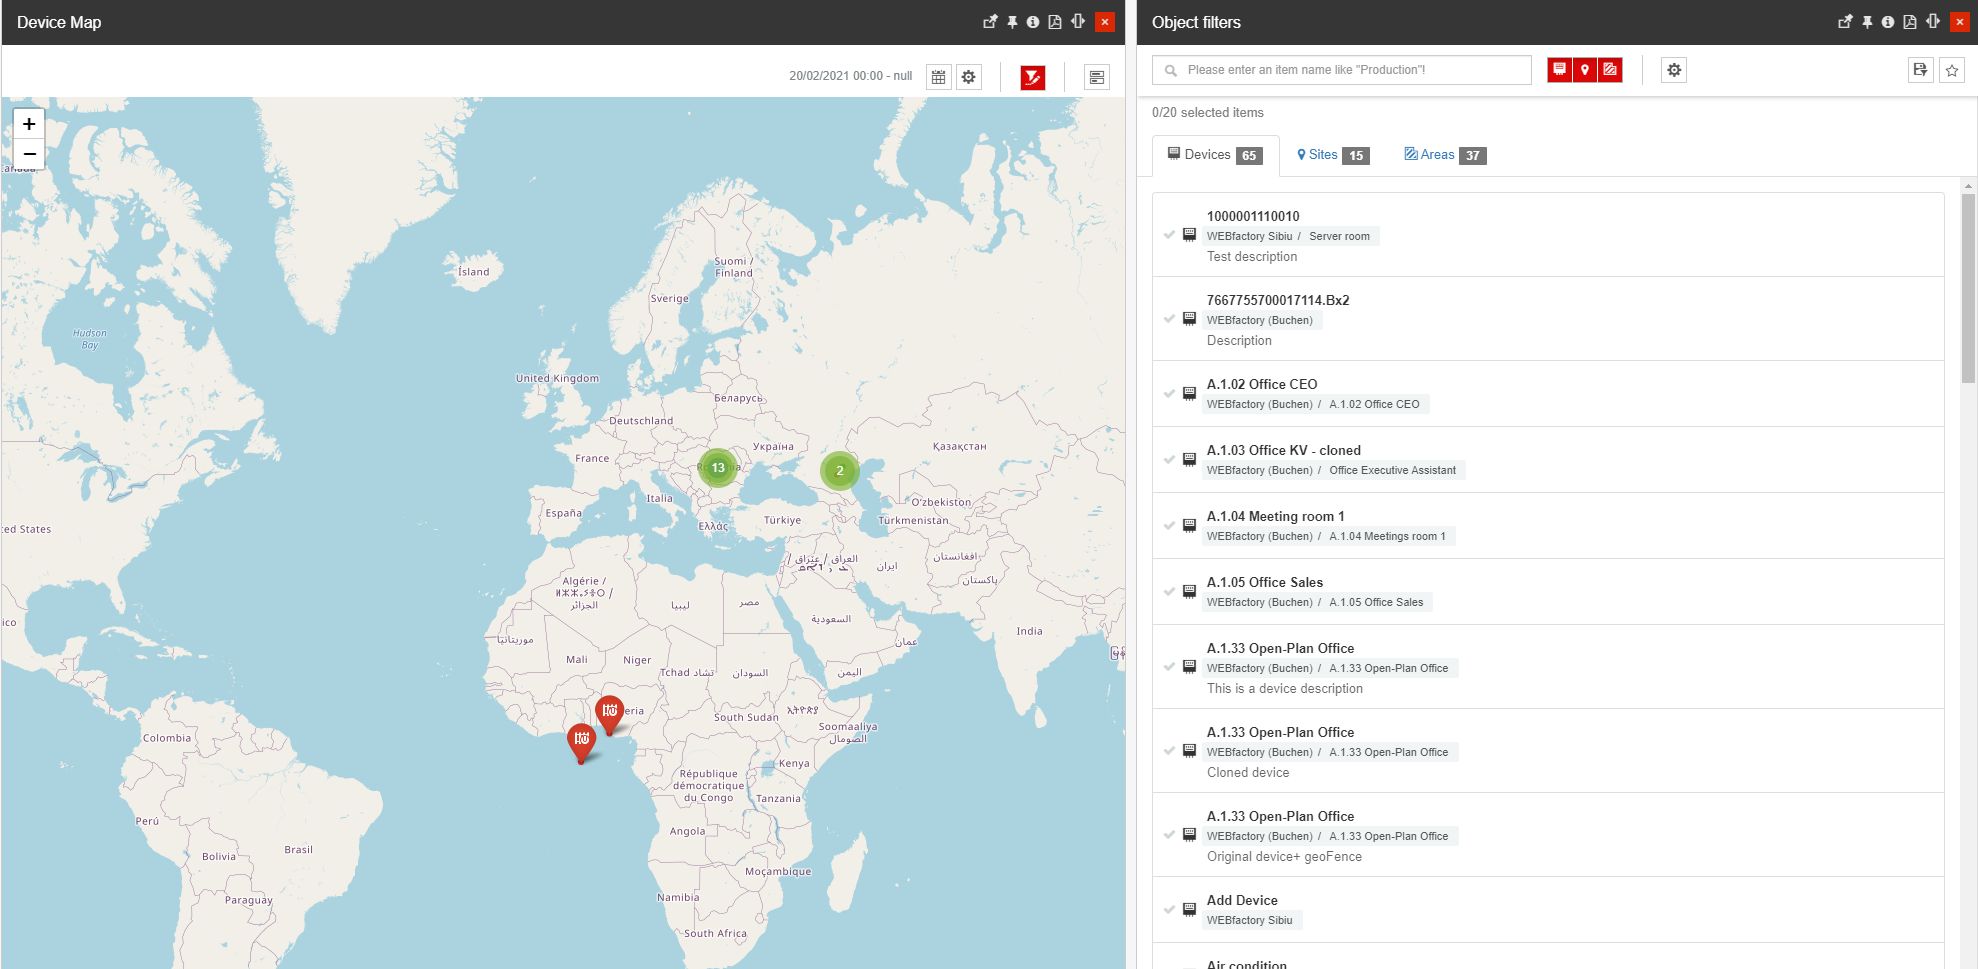
The Object Filters panel
Note
When the Device Map panel is opened in the context of a particular Device, the Object filters will be automatically applied.

Device filter automatically applied
the Event Gantt selector, allowing the user to easily access the Event Gantt panel.

The Event Gantt panel
Tip
For more details about the analysis available in the Event Gantt panel, please also visit the dedicated article, here.
Elements on the map are represented by means of pinpoints. The user can interact with both Geofences and GPS Routes pinpoints, in order to view more details about the involved Device and the triggered alarms.
Therefore, by clicking on a Geofence pinpoint, on the map view, a dialog is displayed, allowing the user to open the following drill-down panels:
Open the Device details panel.
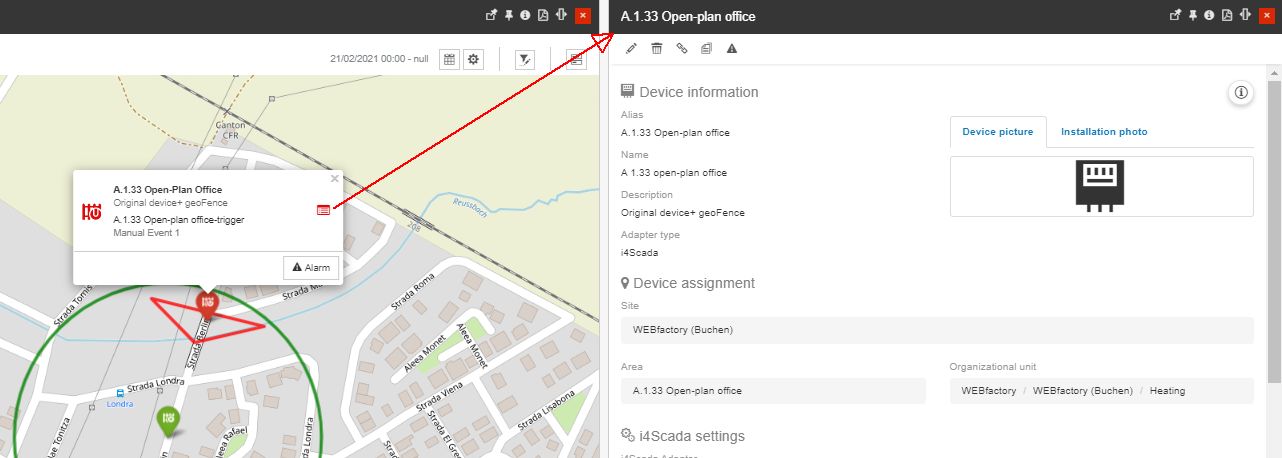
Open the Event gantt panel, focused on the involved Device.

By clicking on a GPS Route pinpoint, on the map view, a dialog is displayed, allowing the user to open the following drill-down panel:
Open the Device details panel.
