Monthly Report
The Monthly Report is a report of the monthly consumption/production statistics, as well as other data like yearly measurements or consumption/production totals.
This article describes the functionality and operation of the Monthly Report panels from the i4connected portal.
The Monthly Report functionality of the i4connected portal provides a dashboard-styled report of the monthly consumption/production statistics. The drill-down functionality allows the user to access the dashboard-style report for the Organisational Units of a customer.
The i4connected Monthly Report is structured in two major sections:
The Measurement groups
The Monthly Report dashboard
The Measurement groups and drill-down
The Monthly Report panel can be accessed by using the dedicated tile. In this view, the tile-based layout provides information on the consumption registered for the last month of the current year.
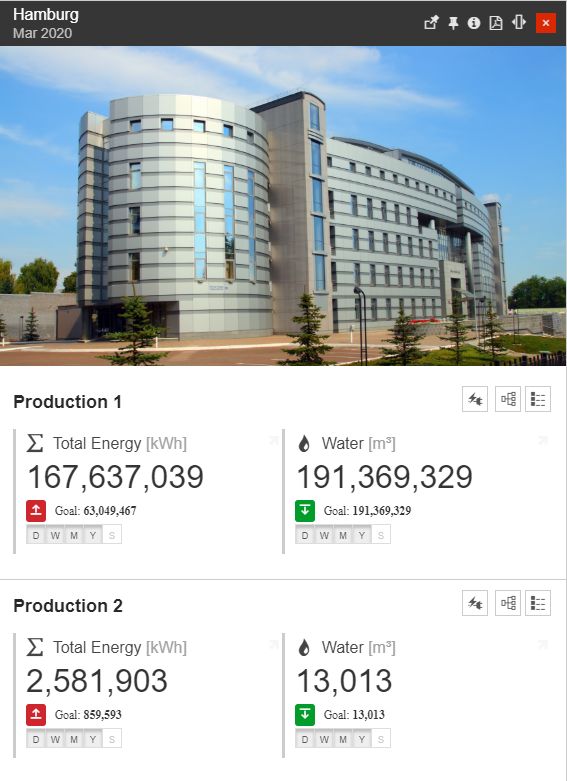
The Measurement groups panel
The toolbar of each child Organizational Unit listed in this panel provides the user with the following options:
Open the Consumption settings view where the user can switch the KPI used for measurements. Selecting a different KPI the panel's tiles to reflect the new data will be automatically updated.
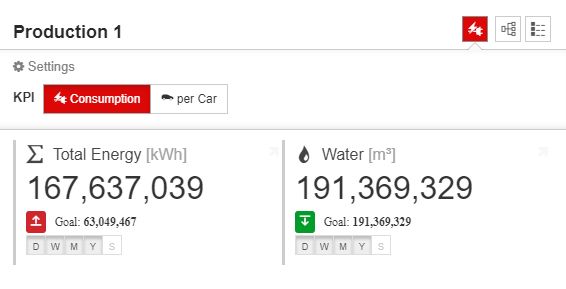
KPI selectors
Open the subordinated Organizational Units Monthly Report, using the drill-down functionality.
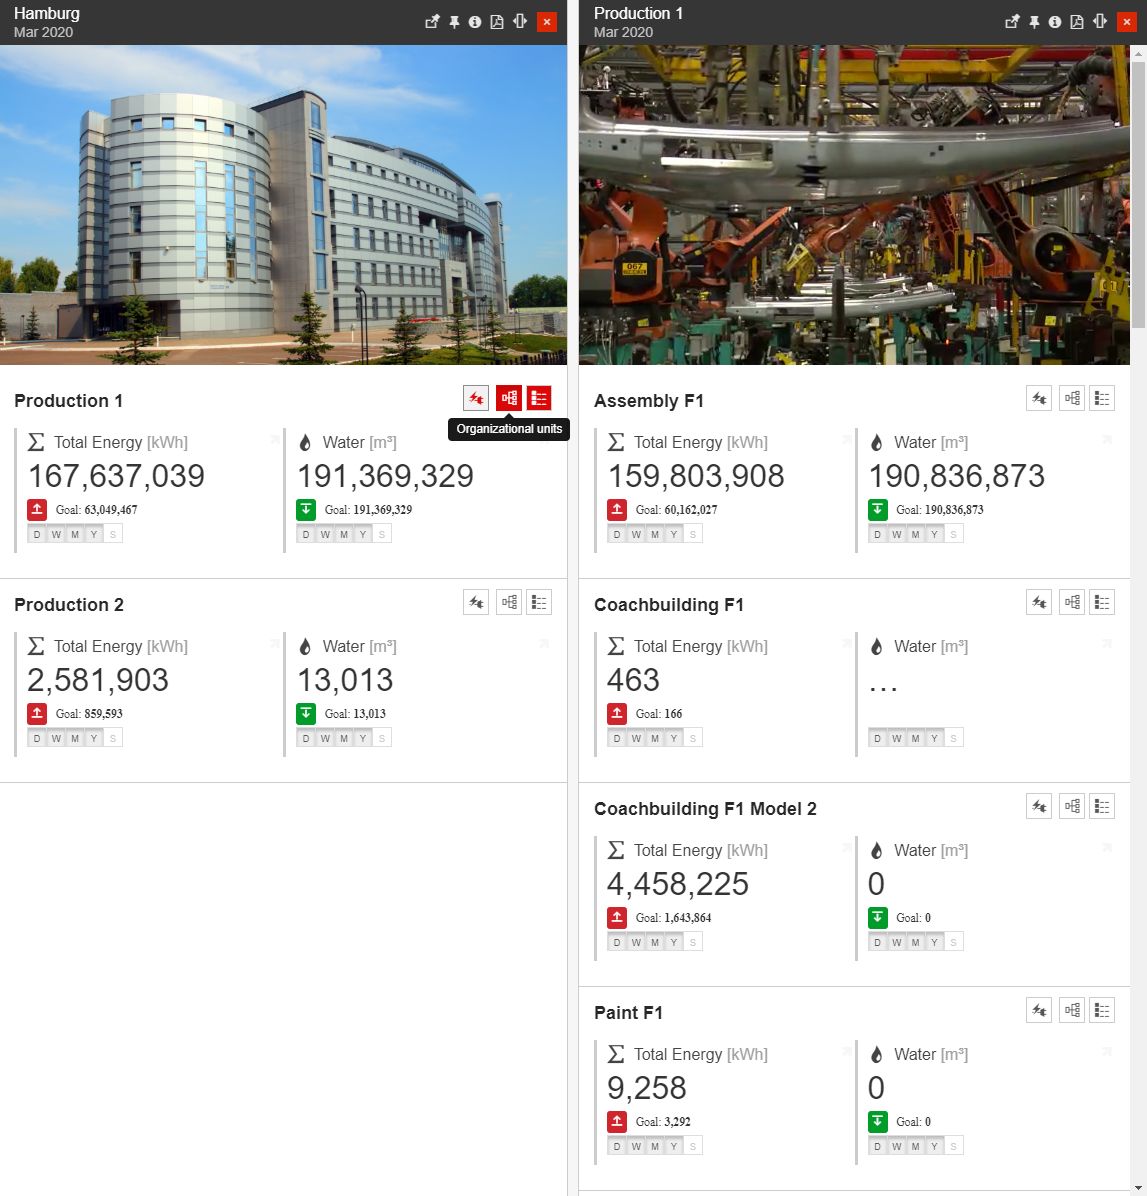
The Drill-Down functionality
Open the Organizational Unit detailed view mode, using the drill-down functionality.
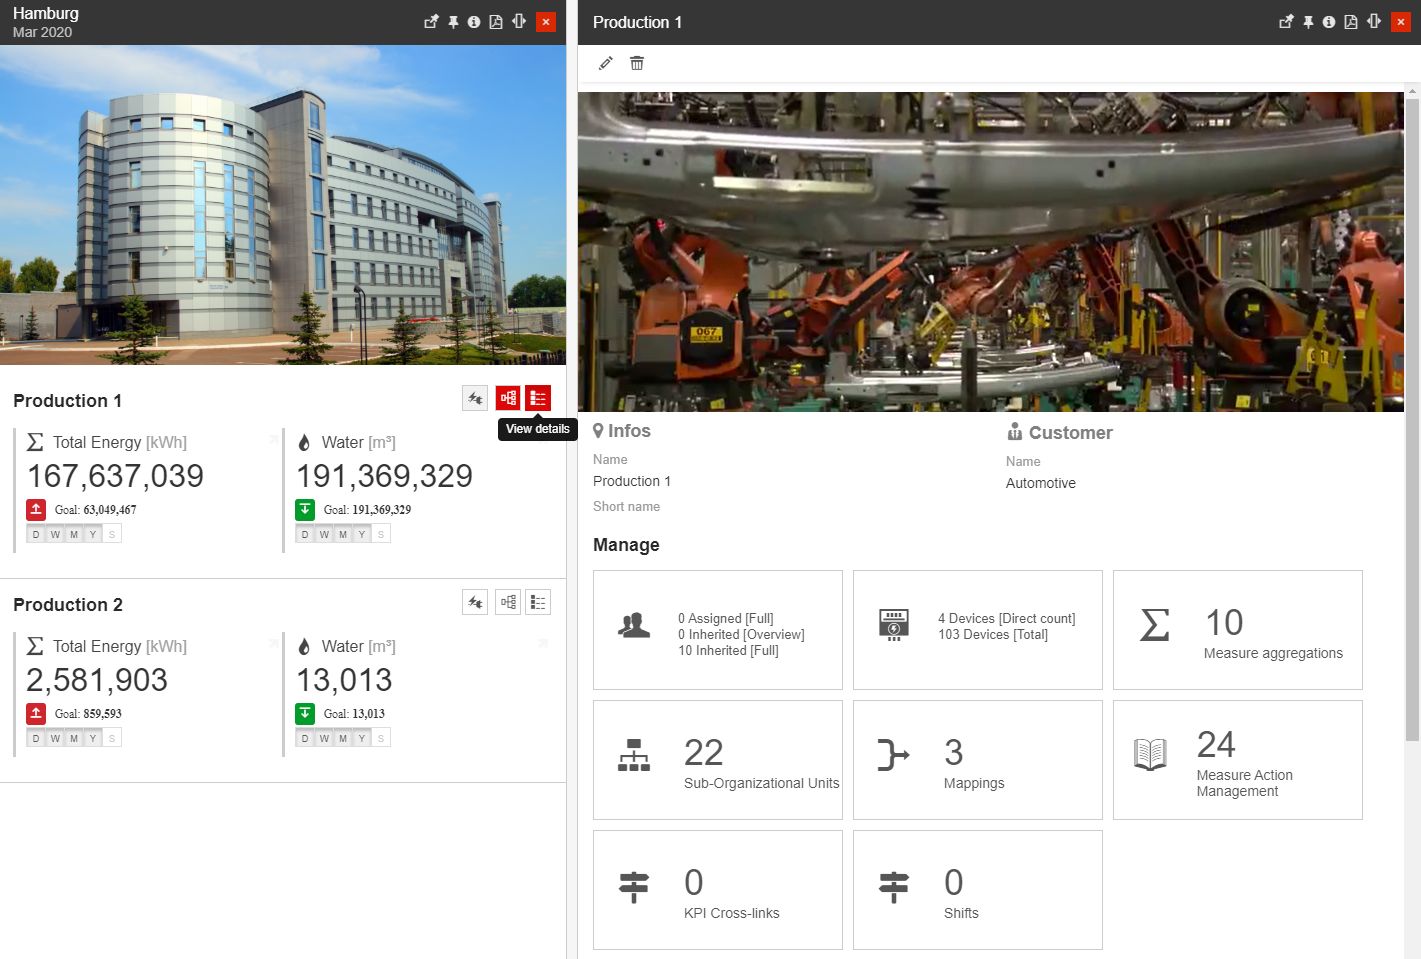
The Organizational Unit detailed view mode
Each consumption tile presents the following information:
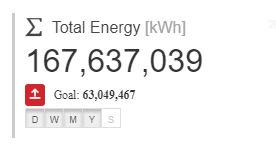
The consumption tile
The name of the aggregated media/KPI
The value of the consumption. This value represents the aggregated measurements of the same media/KPI from all the child organizational units/areas.
The difference between the currently displayed consumption (previous month) and the consumption from one month before (previous to the previous month), for the same media/KPI.
The time periods from which the data is available. If the time period selected in the time selector is greyed out in the tile, no data will be displayed in that tile.
The Monthly Report dashboard
Clicking a tile from the Monthly Report panel or any of its drill-down panels will open the Monthly Report Dashboard. This dashboard displays a monthly consumption/production analysis for the current organizational structure, using the data from the measurement group selected in the Monthly Report panel. By default, the dashboard displays the data using the first KPI available in the selected measurement group.
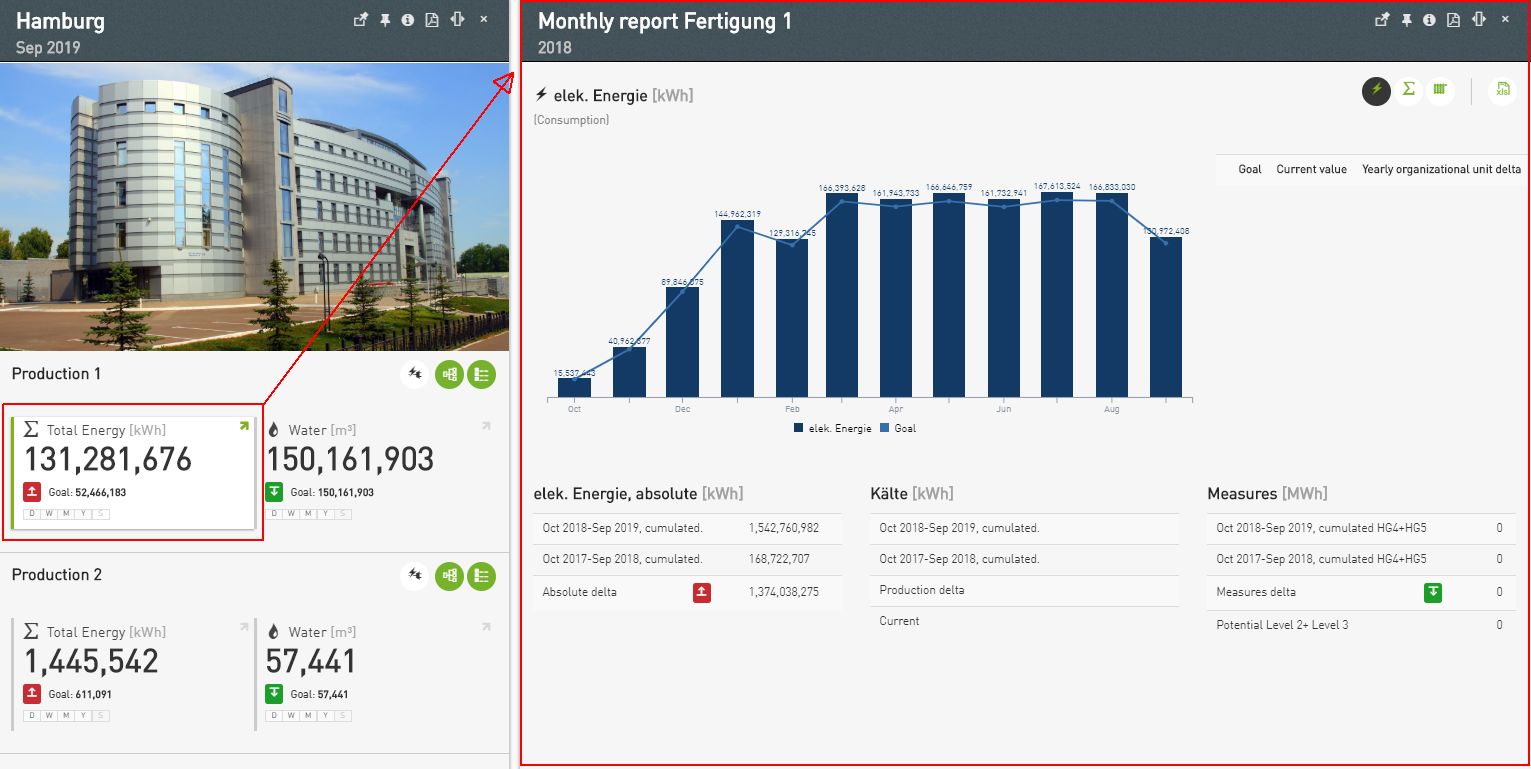
The monthly Report dashboard
The Monthly Report dashboard analysis displays the following information:
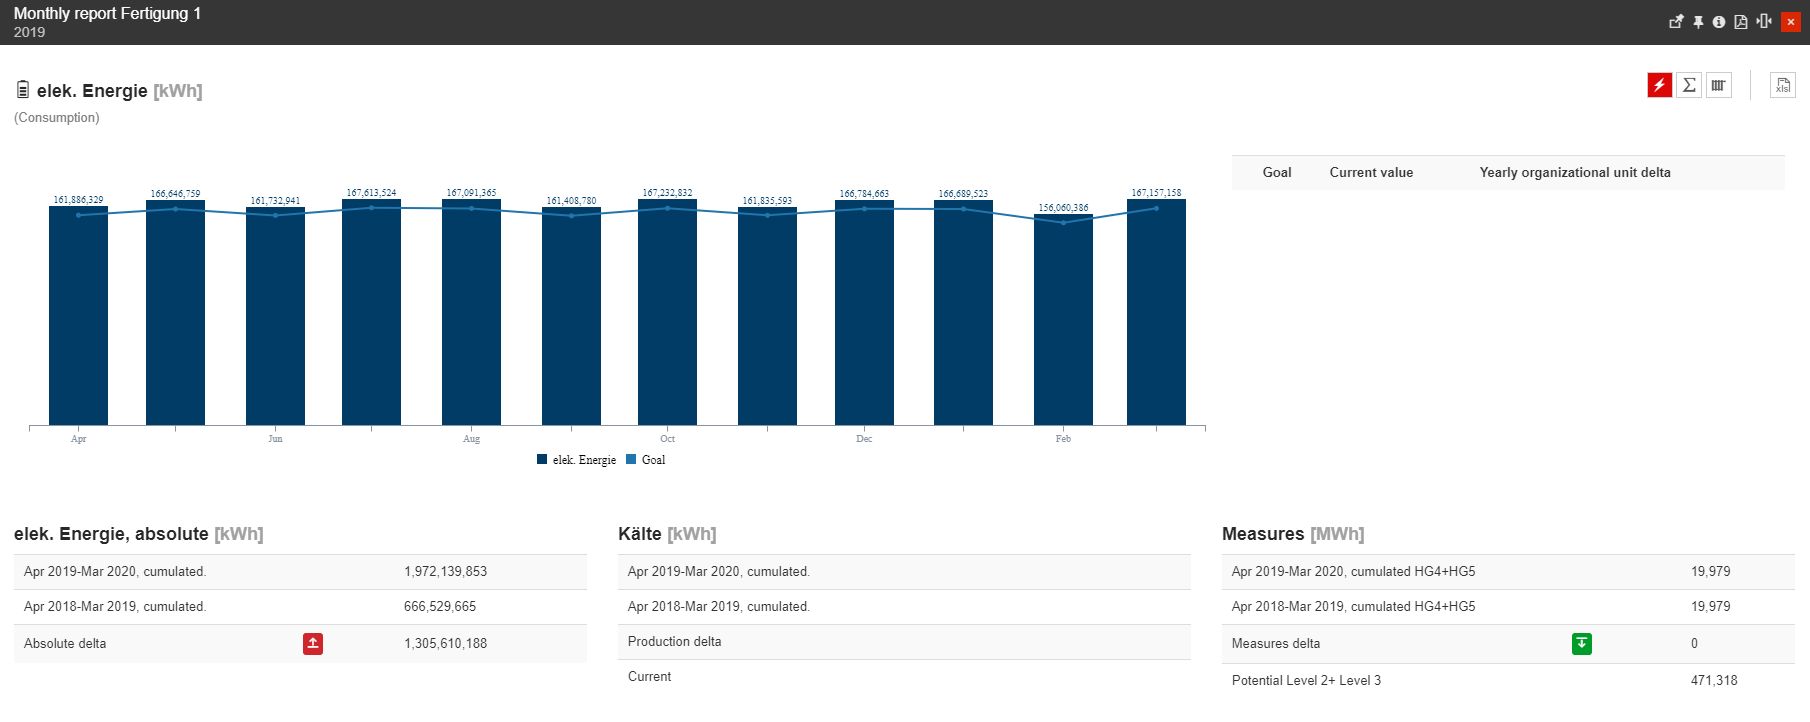
The Monthly report panel
The monthly chart, displays the monthly consumption of the current structure and media type, compared with the goal values. The chart displays the monthly consumption for the whole current year.
The yearly consumption/production table, displays the consumption/production values versus the goal values of the current and related organizational units, over the current year.
The absolute values table, displays cumulative consumption/production values for the current year and the previous year. The previous year's value is used as a goal, so the difference between the two years is displayed along with a status indicator (good/bad).
The production values table, shows the production only values versus production goals for the current year and the previous year. The previous year's value is used as a goal, so the difference between the two years is displayed along with a status indicator (good/bad).
The measures table, shows the implemented and confirmed energy-saving measures of the current year and the previous year. The previous year's value is used as a goal, so the difference between the two years is displayed along with a status indicator (good/bad).
The dashboard allows the user to toggle between the KPIs available in the current measurement group using the top side buttons.

The KPI selectors
The data presented in the dashboard can also be exported to an XLS file, which can be further processed in Microsoft Excel.

The XLS export