Setting up a Raw Data Chart with predefined Signals
Check out this tutorial and learn to configure a new tile opening the Raw Data Chart panel with predefined Signals.
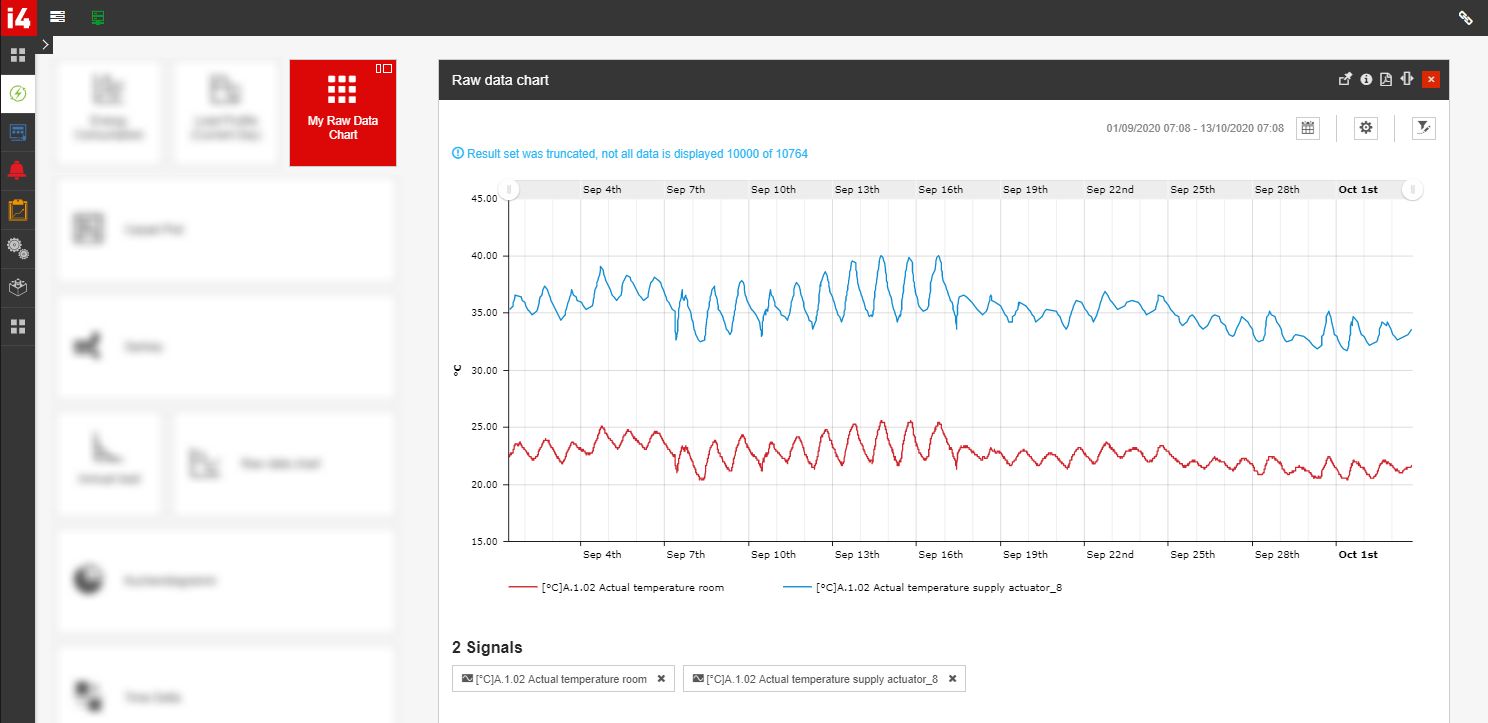
As described by the dedicated article, the Raw Data Chart is a high-resolution chart providing an analysis of one or multiple Signals using their raw values, as read from the Device.
Most probably you may have a set of Signals whose raw measurements are more relevant than others. By following the below-described steps, you can set up a new tile opening the Raw Data Chart with a set of predefined Signals.
Tip
To be able to perform all the steps described in this tutorial, please make sure that your user fulfills the following prerequisites:
the Raw Data Chart tile is available for your user
the Manage shared tiles permission is enabled
the Manage personal tiles permission is enabled, if the new Raw Data chart tile should be saved for personal use, only.
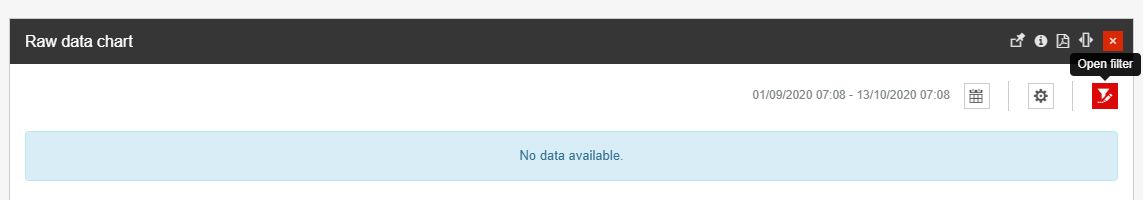
Open a Raw Data Chart and click the Open filter button.
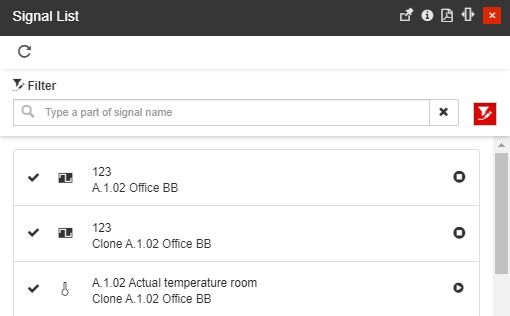
The Signal list panel is opened. In this view, click on the Open filter button.
The Object filters panel is opened. Enable the list of Devices and select the needed ones.
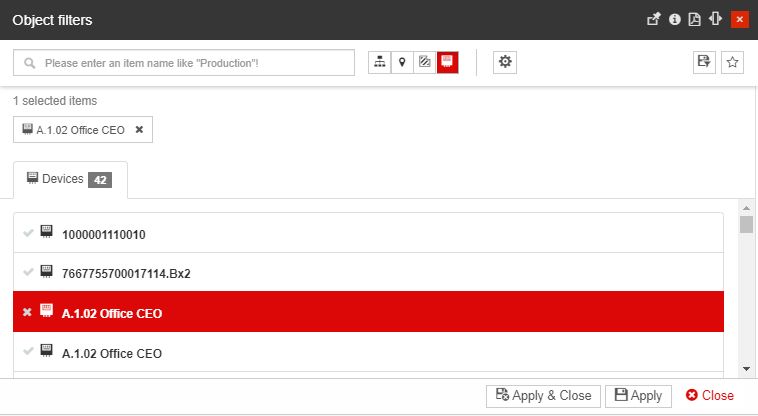
By clicking the Apply and Close button, reduces the items in the Signal List panel to only display those that belong to the selected Devices.
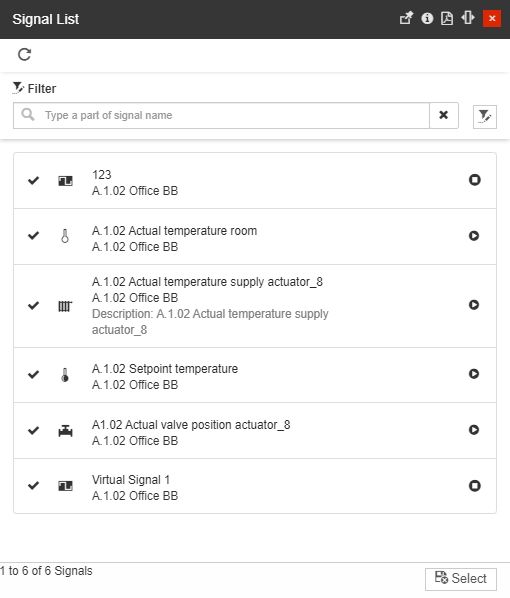
Select the Signal(s) whose measurements you what to view in the Raw Data Chart.
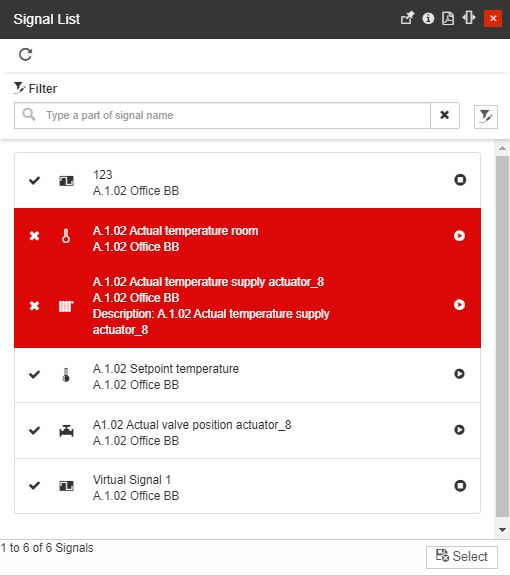
Click the Select button, when you are done with the Signals selection.
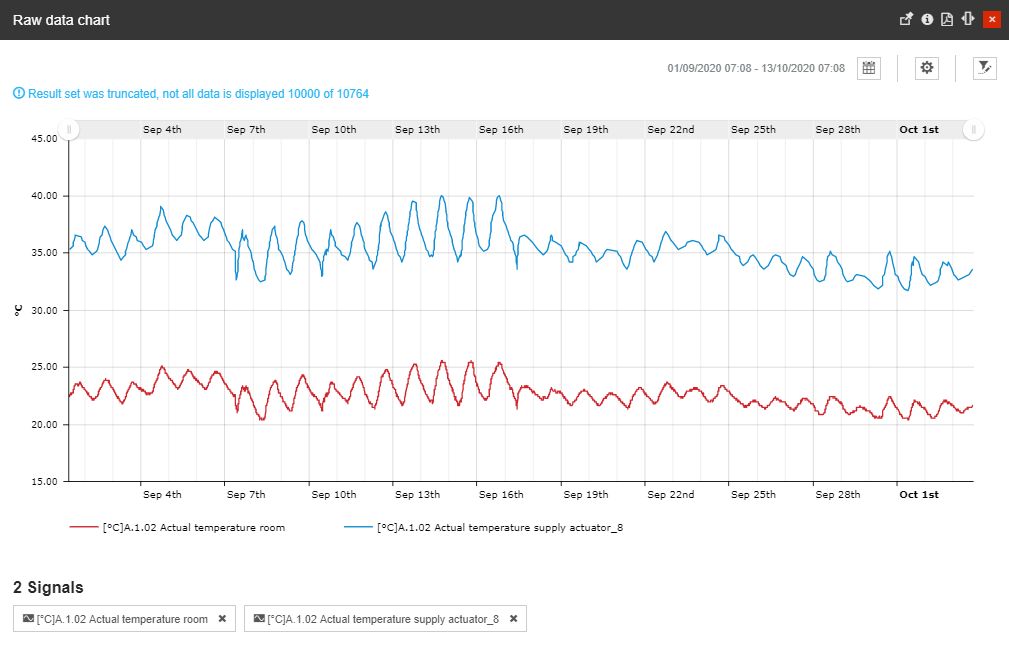
The Raw Data Chart is loaded, displaying the measurements of the applied Signals.
Next, click the Pin panel to tile toolbar button, of the Raw Data Chart panel.
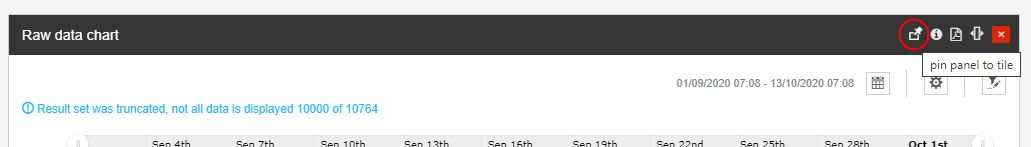
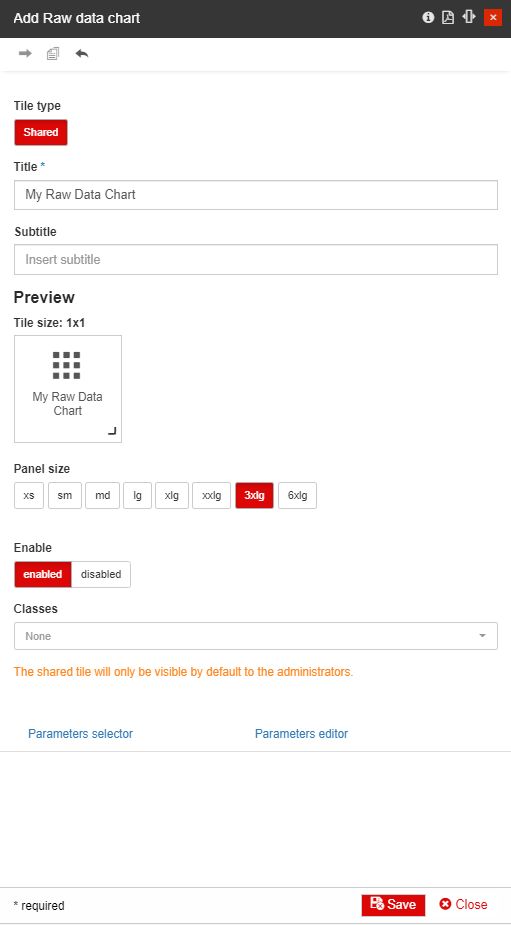
The Add Raw Data Chart panel is opened, allowing you to customize the chart's parameters.
Tip
For more details about pinning panels to tiles, please also visit the dedicated article here.
Click the Save button to preserve your changes.
A new tile is added to the current page, When opening the new tile, the Raw Data Chart panel is opened displaying your settings.