Measures import tool
This article provides information regarding the measures data import procedure and the required Excel template.
This article provides information regarding the measures data import procedure and the required Excel template.
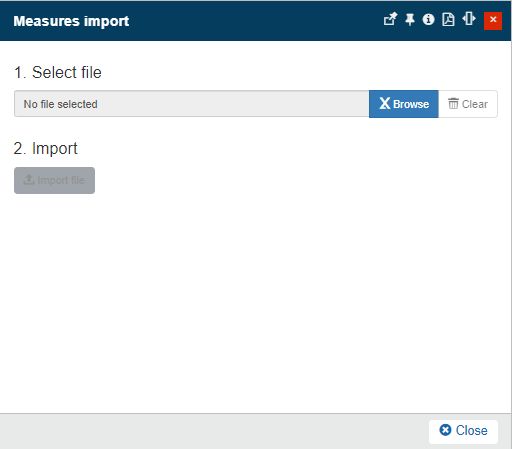
The measures data import in i4connected is done by uploading the appropriate Excel document, containing all the required information, in the administration section of the i4connected portal by clicking the Measures Import tile.

The Measures Import tile
The Measures Import panel allows the Admin user with the possibility to upload measurements using an Excel file, structures as described in the following sections.

The Measures Import panel
The Measures Data Import template
The Excel template used for importing measures data in the i4connected is a classic spreadsheet having the following columns:
Column Name | Description |
|---|---|
Site | The location where the measures are being applied |
Organizational Unit | Organizational Unit matching the existing Organizational Unit from the database. |
Number | The UNIQUE number of the measure |
Title | The title of the measure |
Status | The status of the measure:
|
Current Date | The most recent date when the measure changed its status |
Expected Date for Status 4 | The date when the measure is expected to reach Status 4 |
Expected Date for Status 5 | The date when the measure is expected to reach Status 5 |
Created On | The date when the measure was created |
Owner | The person responsible for the measure |
Media type | The media types affected by the measure |
Topic | The general description of the savings implied by the measure |
Workshop | The workshop in which the measure and its implementation is explained |
Workshop Host | The person responsible for the workshop |
Workshop Starts On | Workshop start date |
Workshop Ends On | Workshop end date |
Origin | The origin of the measure idea |
Energy Cycle | The area of energy production or energy consumption |
Trade | Production trade (e.x. Plastics, Wheels, etc.) |
Media | The exact media for which the measurement is applied |
Investment | The amount of money required to implement the measure |
Running costs | The amount of money required to run the measure |
Savings | The potential amount of money to be saved each year |
Payback | The number of years required to cover the investment and the running costs |
Country | The country where the measure is applied |
City | The city where the measure is applied |
Electricity | The potential savings for electricity in MWh |
CO2 Emission Factor | The CO2 emission factor for electricity |
CO2 Emission | The total CO2 emission for electricity |
Heating | The potential savings for heating in MWh |
CO2 Emission Factor | The CO2 emission factor for heating |
CO2 Emission | The total CO2 emission for heating |
Gas | The potential savings for gas in MWh |
CO2 Emission Factor | The CO2 emission factor for gas |
CO2 Emission | The total CO2 emission for gas |
Fuel | The potential savings for fuel in MWh |
CO2 Emission Factor | The CO2 emission factor for fuel |
CO2 Emission | The total CO2 emission for fuel |
Total CO2 Reduction | The total amount of CO2 that is not released |
Water | The expected savings for water |
Other | The expected savings for other media types |
Final Situation | The description of the goal |
Initial Situation | The description of the current situation |
Remarks | Additional remarks |
Calculation / Explanation | The calculation for savings |
Deadline Status | The days left to finish |
Stopped At Status 9 | The explanation why the measure switched to Status 9 |
Status 9 Date | The date when the measure switched to Status 9 |
Last Change Date | The date of the last measure change |
Responsible for Change | The person responsible for the last change |
Up to Date | A flag that states if the entry is up to date |
Status 4 Date | The date when the measure switched to Status 4 |
Status 5 Date | The date when the measure switched to Status 5 |
VOC Emissions | The savings for VOC emissions |
Waste | The savings for waste |
Toxic Waste | The savings for toxic waste |
Source measure number | The number of the source measure |
Attached Files No. | The number of attached files |
Expected Date for Status 2 | The date when the measure is expected to reach Status 2 |
Expected Date for Status 3 | The date when the measure is expected to reach Status 3 |
Status 1 Date | The date when the measure switched to Status 1 |
Status 2 Date | The date when the measure switched to Status 2 |
Status 3 Date | The date when the measure switched to Status 3 |
Calculation Methods
In order to correctly insert the data in the import template columns, the method that i4connected uses to display the data must be understood.
If the data is not placed correctly in the import template's columns, i4connected will not display the measures data correctly in the measures section.
Total savings for a specific status
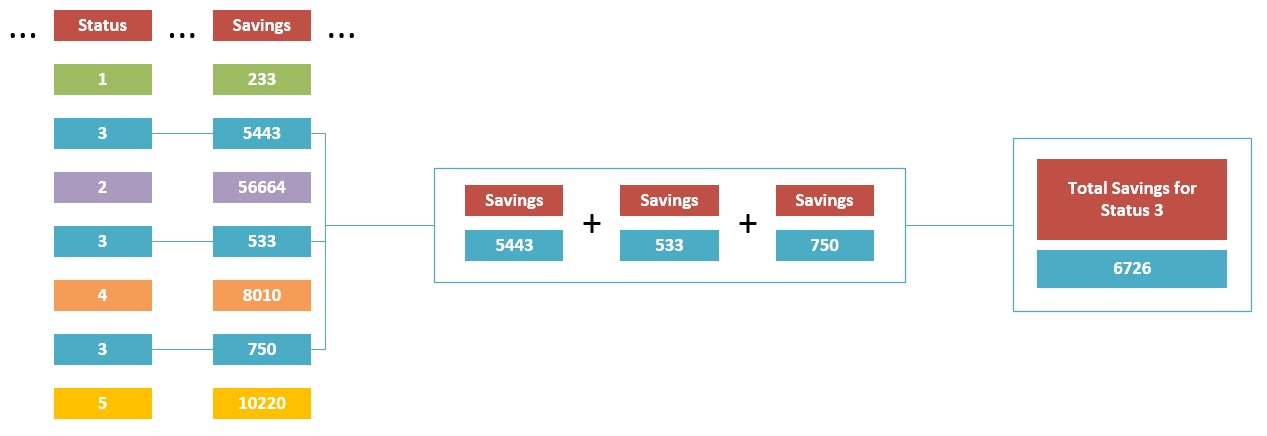
i4connected calculates the total savings for a given status by summing all the values of the Savings column for all the measures which have the same given status. For example, the total savings for the measures at status 3 (measures that have been decided upon) would be calculated in a manner similar to this scheme:

Total savings for a specific status
Total energy savings for a specific status
i4connected calculates the total energy savings for a given status by summing all the values of the Electricity, Gas , and Heating columns for all the measures which have the same given status. For example, the total savings for the measures at status 3 (measures that have been decided upon) would be calculated in a manner similar to this scheme:

Total energy savings for a specific status
Filtering criteria based on time selection
i4connected computes the filtering criteria based on the Status, Expected Date for Status 4 , and Current Date columns from the measures data import template and the intersections of the predefined Goals time interval, current year, and the user-selected time interval.
The Goal's start and end years are configurable within the i4connected portal.
The default selected time interval, if the user doesn't make any time selection, is the current year.
There are three predefined rules of filtering the measures in i4connected:
Filtering for Status 1 (identified potential savings) - All the measures are displayed, considering that all the measures are based on the potential savings that their implementation would provide.
Filtering for Status 2 or 3 (the potential savings are validated or the measures have been decided upon but are not implemented yet) - Displays all the measures that have the Status 2 or 3 and their Expected Date for Status 4 date (the date to be implemented) is anywhere inside the time range defined by the intersection of the user-selected interval and the interval between the beginning of the current year and the end of the Goal's final year.

Filtering for status 2 or 3
Filtering for Status 4, 5, or 9 (the implemented measures, including those with already confirmed savings and uneconomical/postponed ones) - Displays all the measures that have the Status 4, 5, or 9 and their Current Date date (the date of the latest status change) is anywhere inside the time range defined by the intersection of the user-selected interval and the interval between the beginning of the Goal's start year and the end of the current year.

Scatter diagram calculation
On the Scatter diagram, each measure is represented using two defining values, Savings, and Payback. The Savings value determines the position on the vertical axis and the Payback determines the position on the horizontal axis. The intersection of these two values in the Cartesian space represents the measure.
The Payback value of the measure in the Scatter diagram corresponds to the value from the Payback column inside the data import template.
The Savings value is calculated as the sum of the values from the Electricity, Heating, and Gas columns inside the data import table.
Other Scatter diagram information like the Measurement Number or the Title have direct correspondence with the columns inside the data import template:
The Measurement Number value is taken from the Number column.
The Title value is taken from the Title column.