Setting up a Bar graph with various parameters
Check out these tutorials analyzing different measurements of one single use case and learn how to achieve the described results.
For a better understanding of the power of i4connected analysis and monitoring modules, we have prepared this hypothetical hierarchical structure that demonstrates the relationship between a production location, its associated devices, and their signals:
Location | Location | Machine | Signal |
|---|---|---|---|
Site | Area 1 | Device 1 | Produced parts |
Outside temperature | |||
Machine temperature | |||
Machine status:
| |||
Area 2 | Device 2 | Produced parts | |
Outside temperature | |||
Machine temperature | |||
Machine status:
| |||
Area 3 | Device 3 | Produced parts | |
Outside temperature | |||
Machine temperature | |||
Machine status:
| |||
Area 4 | Device 4 | Produced parts | |
Outside temperature | |||
Machine temperature | |||
Machine status:
| |||
Area 5 | Device 5 | Produced parts | |
Outside temperature | |||
Machine temperature | |||
Machine status:
|
Bar graph of production per Device
Check out how to configure the Load profile graph to analyze the amount of produced parts, per machine.
The i4connected Load profile module helps you calculate and analyze various data series, obtained from an intersection between the chosen objects, the selected time range, and the available KPIs.
This article guide describes the chart parameter settings required by the Load profile to generate data for our hypothetical hierarchical structure.
Enter in Edit tile mode by clicking the top toolbar button.

Select the edit option of the Load profile tile,
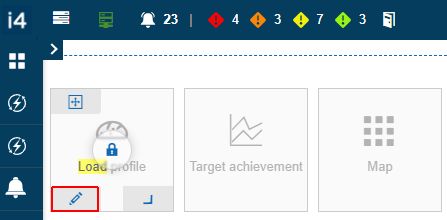
Expand the Parameters selector under the Edit tile panel.
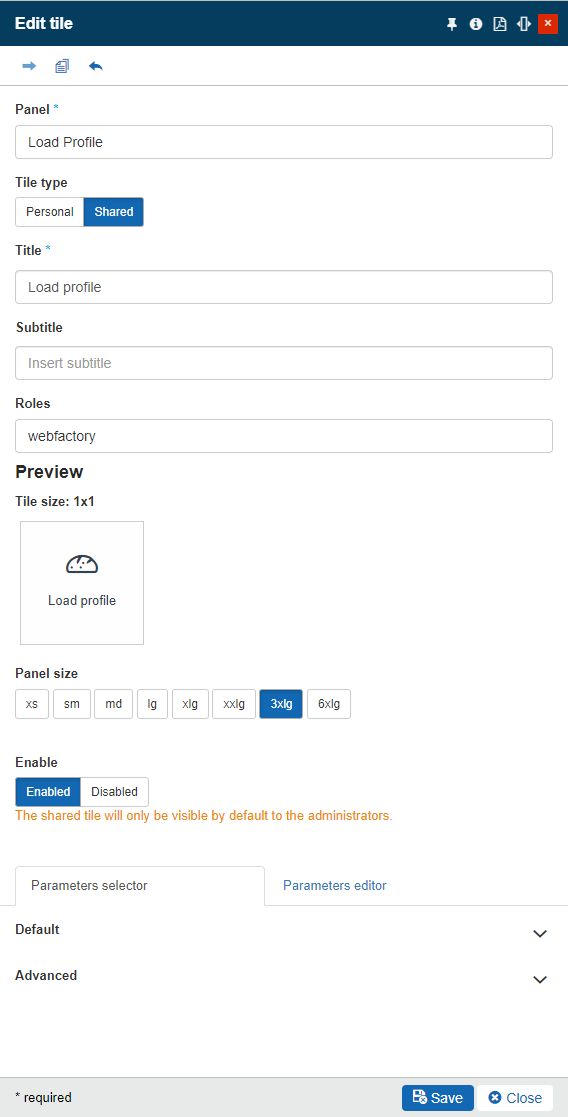
Under the Default section of the Parameters selector panel proceed with the following settings:
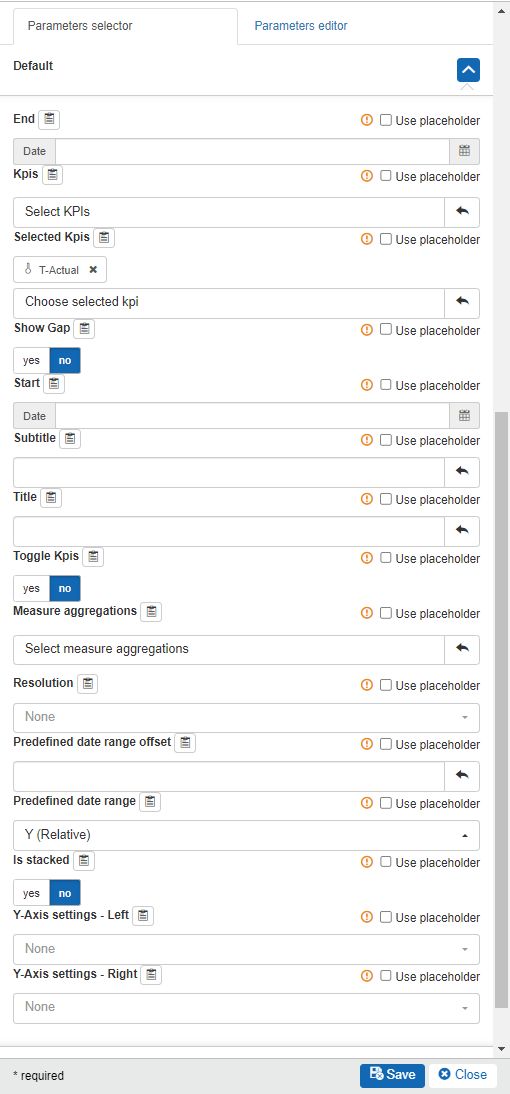
Select the desired KPI(s) used by the chart to plot data.
Define further chart parameters, such as Start date, End date, Measure aggregation, Resolution, etc.
Under the Advanced section of the Parameters selector panel proceed with the following settings:
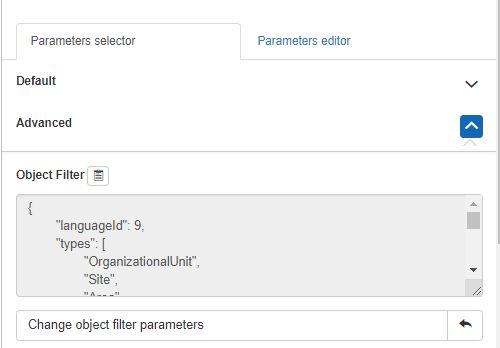
Click on the Change object filters parameters selector.
In the Edit object filter patterns panel expand the Default options.
Identify the Choose selected items selector and use it to apply your Device.
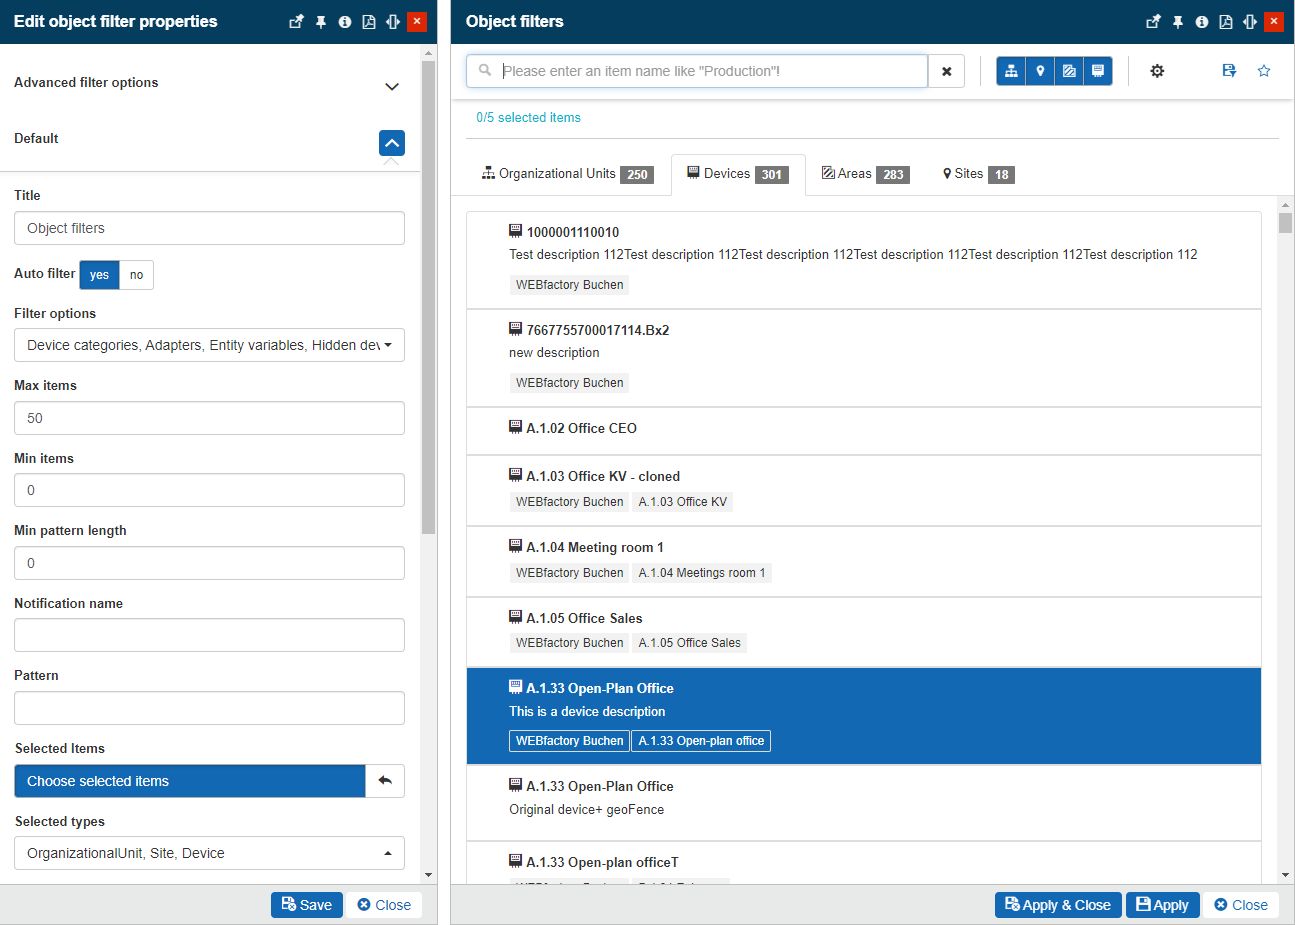
Make sure to preserve the changes by clicking the Save button of the Edit tile panel.
Exit the Edit tile mode.
Open the Load profile panel and start your production Analysis.
Bar graph of total production per Site
Check out how to configure the Load profile graph to analyze the total produced parts, per site.
The i4connected Load profile module allows you to analyze the productivity of complex structures such as the one described here. To check the total production of a Site and all its substructures, a set of parameters needs to be set, as follows:
Enter in Edit tile mode by clicking the top toolbar button.

Select the edit option of the Load profile tile,

Expand the Parameters selector under the Edit tile panel.

Under the Default section of the Parameters selector panel proceed with the following settings:
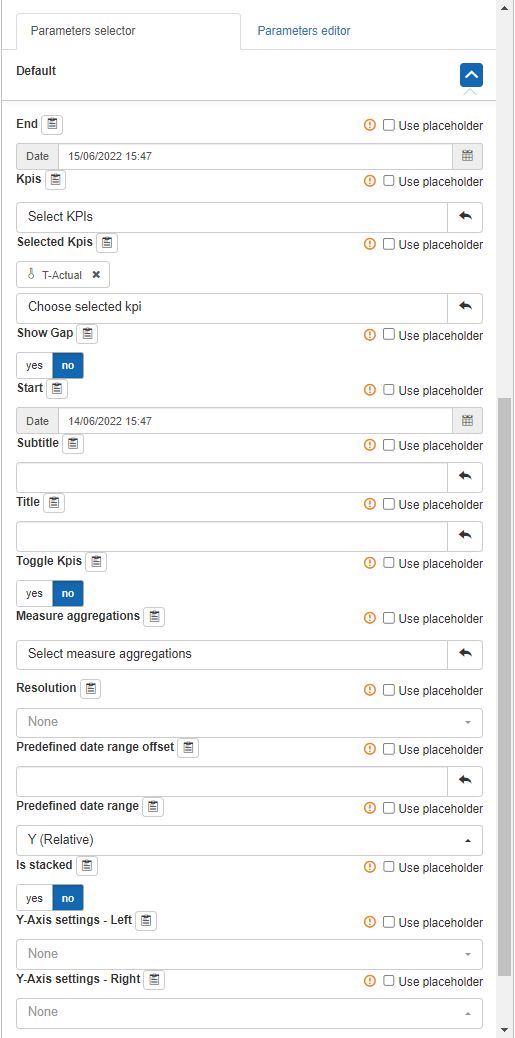
Select the desired KPI(s) used by the chart to plot data.
Define further chart parameters, such as Start date, End date, Measure aggregation, Resolution, etc.
Under the Advanced section of the Parameters selector panel proceed with the following settings:

Click on the Change object filters parameters selector.
In the Edit object filter patterns panel expand the Default options.
Identify the Choose selected items selector and use it to apply your Site.
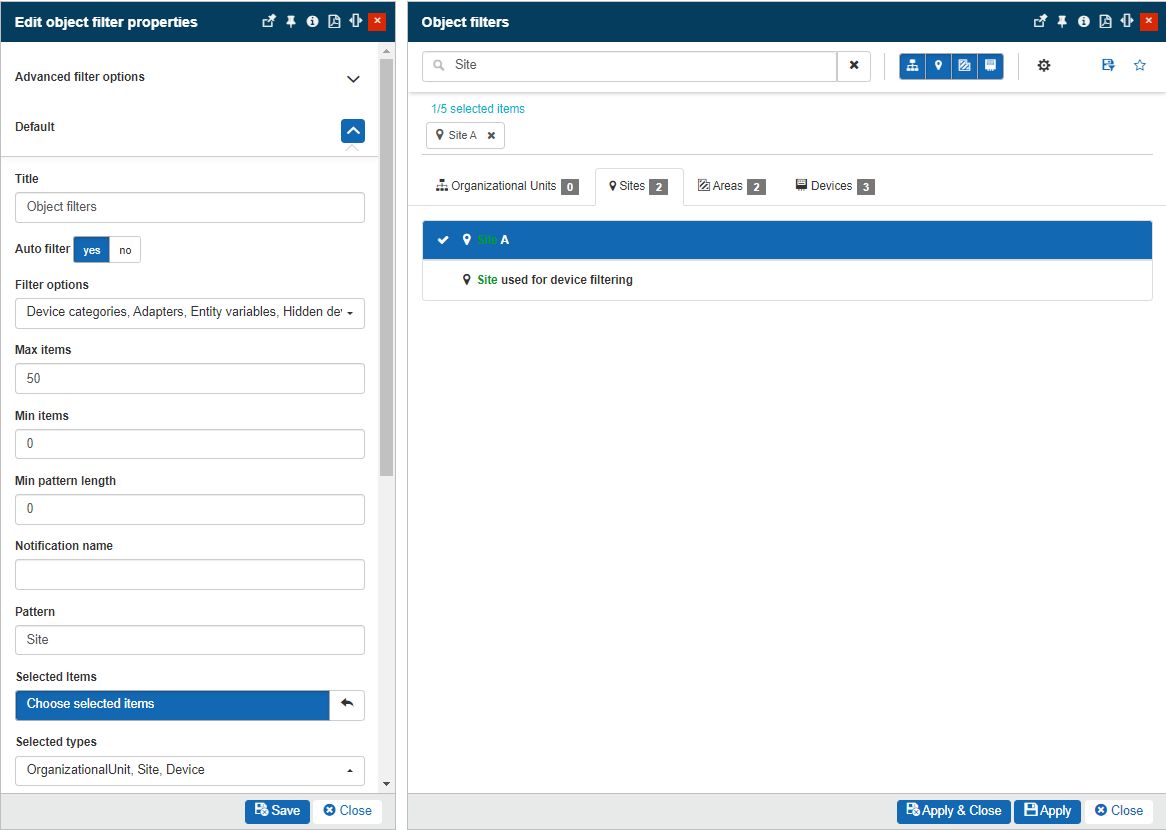
Make sure to preserve the changes by clicking the Save button of the Edit tile panel.
Exit the Edit tile mode.
Open the Load profile panel and start your production Analysis.
Line graph of Device registered temperature
Check out how to configure the Annual Load graph to check and prepare a complete analysis of your device measurements.
Having a complex hierarchical structure does not prevent you from analyzing very specific measurement data of your structural objects.
This tutorial describes the steps needed to parametrize the Annual load dashboard to measure a Device temperature:
Enter is Edit tile mode by clicking the top toolbar button.

Select the edit option of the Annual load tile,
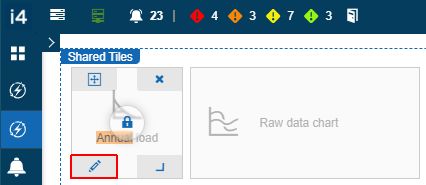
Expand the Parameters selector under the Edit tile panel.
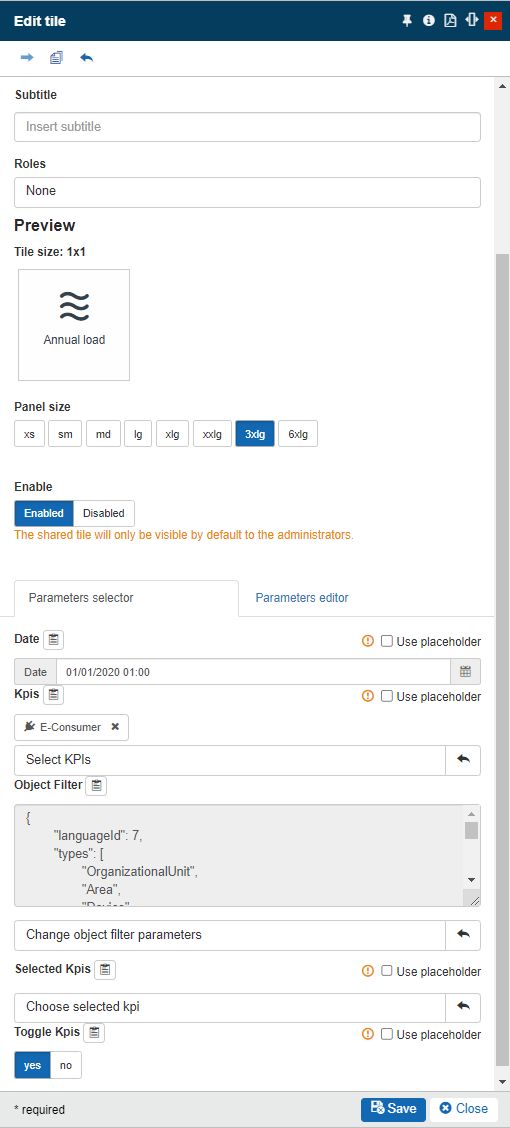
Under the Parameters selector area proceed with the following settings:
Set the chart start Date.
Click on the Select KPIs selector and choose the KPIs used by the chart to plot data.
Click on the Change object filter parameters selector and choose the Site or Area of interest.
Make sure to preserve the changes by clicking the Save button of the Edit tile panel.
Exit the Edit tile mode.
Open the Annual load panel and start your production Analysis.
Device temperature and outside temperature delta measurement
Check out how the Object delta graph can be used to compare two measurements of the same Device.
Using the Object delta dashboard you can compare two similar measurements of the same object. Proceed as follows to parametrize the Object delta dashboard:
Enter is Edit tile mode by clicking the top toolbar button.

Select the edit option of the Load profile tile,

Expand the Parameters selector under the Edit tile panel.

Under the Default section of the Parameters selector panel proceed with the following settings:
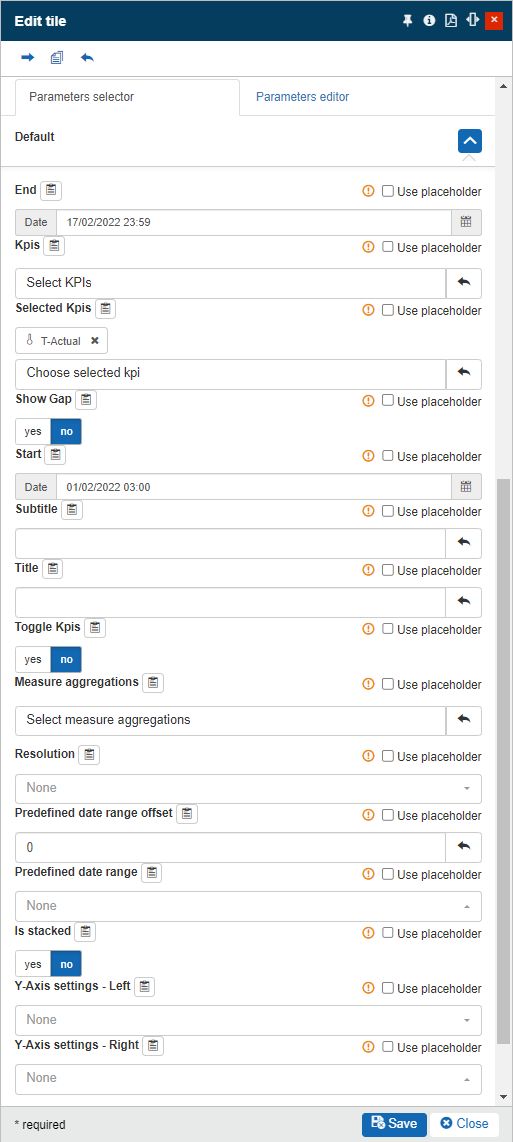
Select the desired KPI(s) used by the chart to plot data.
Define further chart parameters, such as Start date, End date, Measure aggregation, Resolution, etc.
Under the Advanced section of the Parameters selector panel proceed with the following settings:

Click on the Change object filters parameters selector.
In the Edit object filter patterns panel expand the Default options.
Identify the Choose selected items selector and use it to apply your Device.
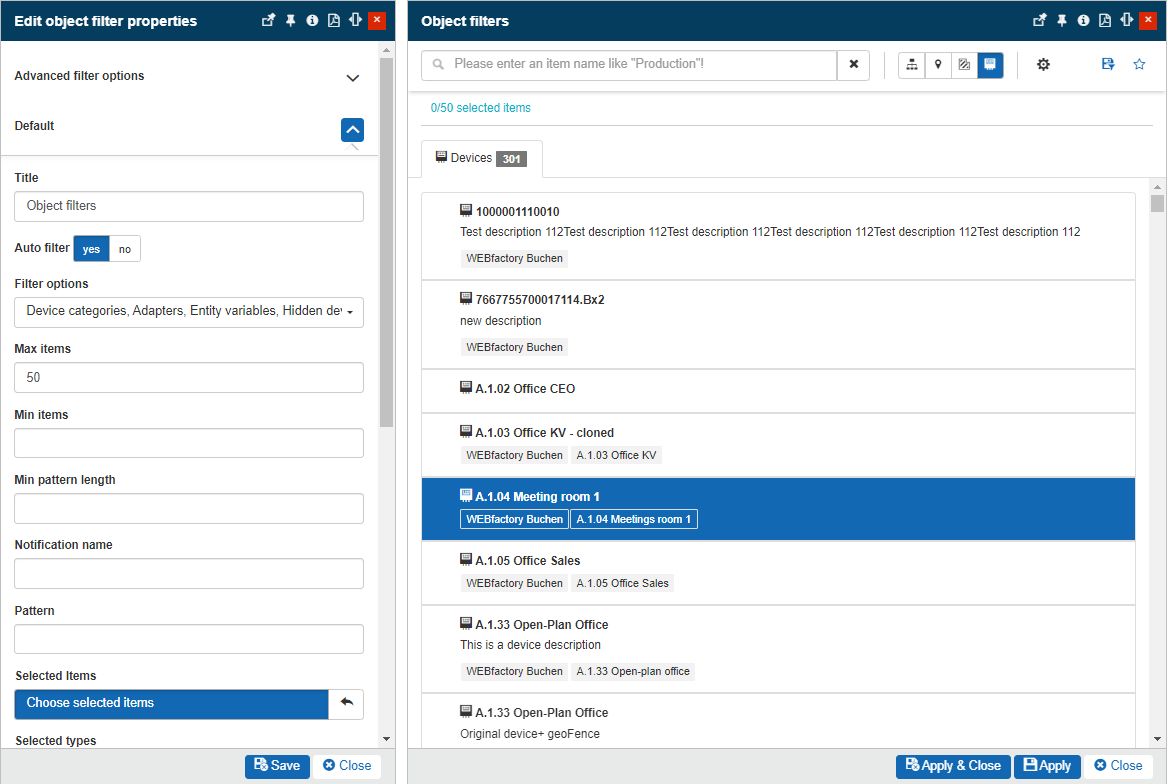
Make sure to preserve the changes by clicking the Save button of the Edit tile panel.
Exit the Edit tile mode.
Open the Load profile panel and start your production Analysis.
Bar graph of Device states by Count and Duration
Check the distribution of your Device statuses throughout a predefined time frame, using the Event Rankings dashboard.
The Event Rankings dashboard can help you display statistical data of the events engaged in your project, using one of the two common KPIs: Count and Duration.
To proceed with the statistical analysis the following parameters need to be set:
Enter is Edit tile mode by clicking the top toolbar button.

Select the edit option of the Annual load tile,

Expand the Parameters selector under the Edit tile panel.
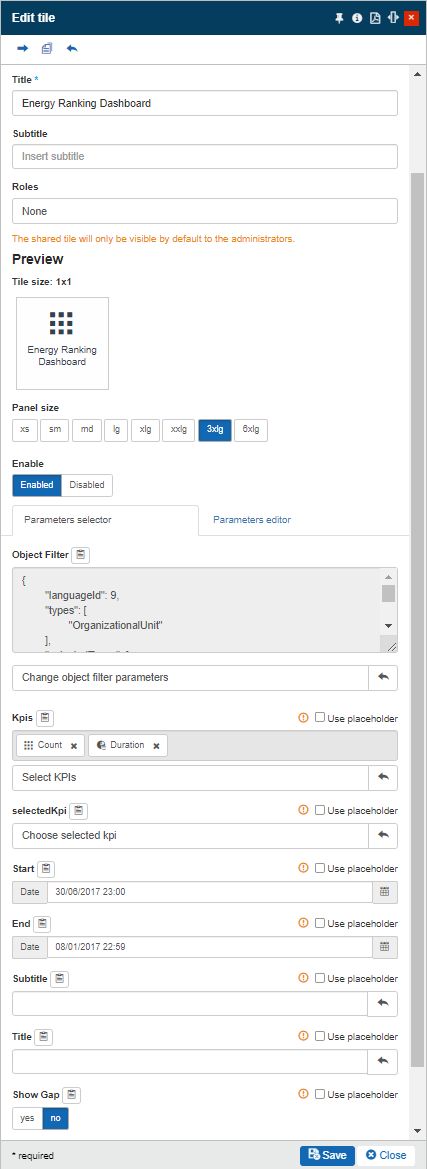
Under the Parameters selector area proceed with the following settings:
Click on the Change object filter parameters selector and choose the Device of interest.
Click on the Select KPIs selector and choose the KPIs used by the chart to plot data.
Set the chart Start and End dates.
Make sure to preserve the changes by clicking the Save button of the Edit tile panel.
Exit the Edit tile mode.
Open the Annual load panel and start your production Analysis.