Signal Online Table
The Signal Online Table panel provides a visualization of the online signal values imported from devices.
This article describes the Signal Online Table panel available by clicking the dedicated tile. The Signal Online Table provides a visualization of the online signal values from imported devices.
By default, the Signal Online Table will list all the signals available in the system. The list can be filtered and sorted as described below.
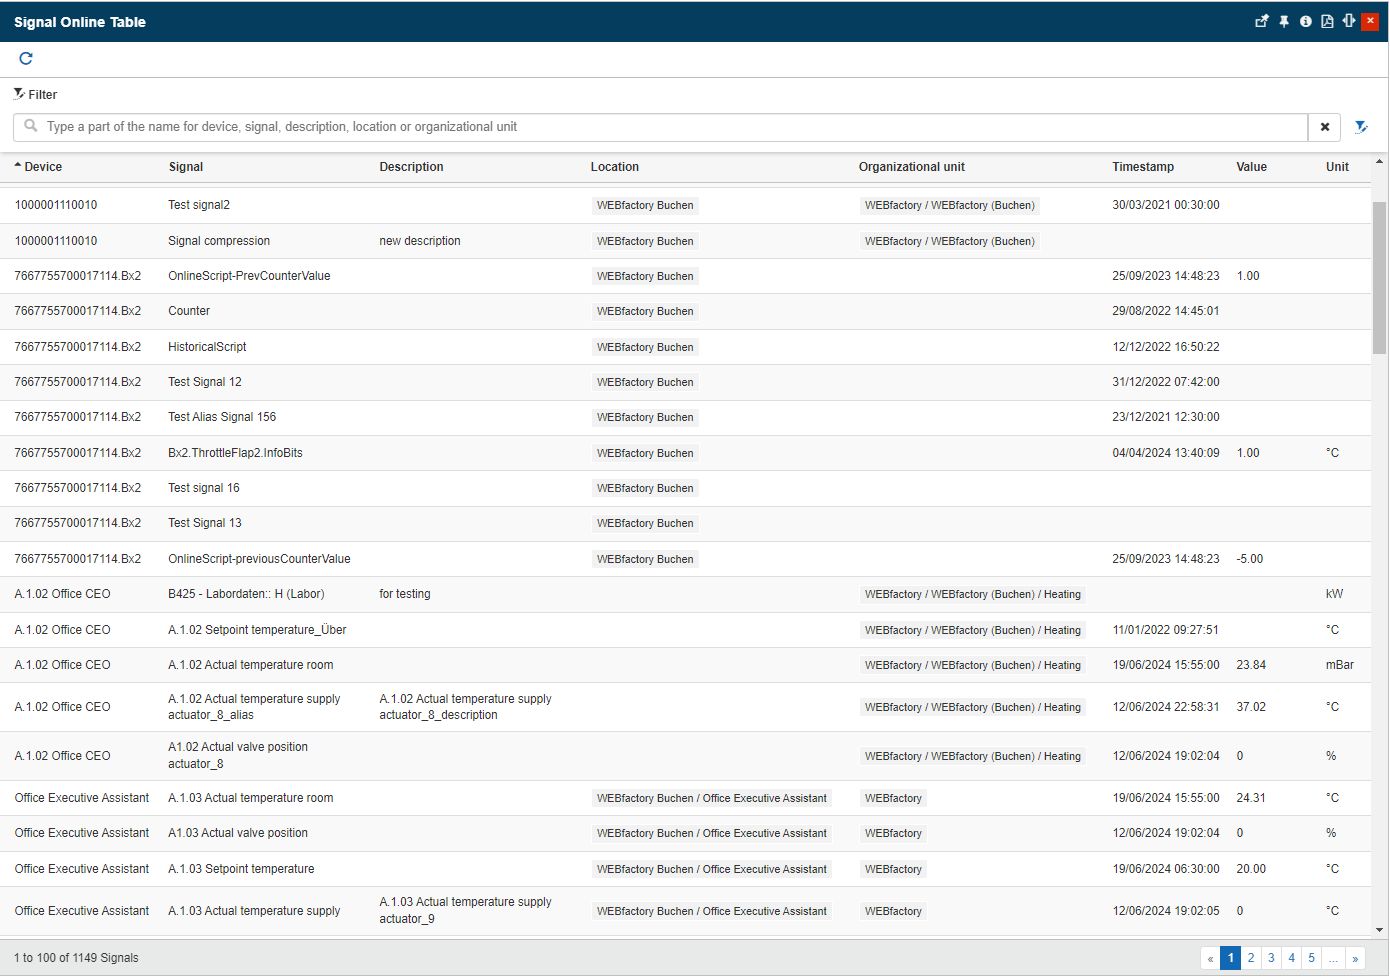
The Signal Online Table panel
The Signal Online Table is split into multiple columns as follows:
Device
Signal
Description
Location
Organization unit
Timestamp
Value
Unit
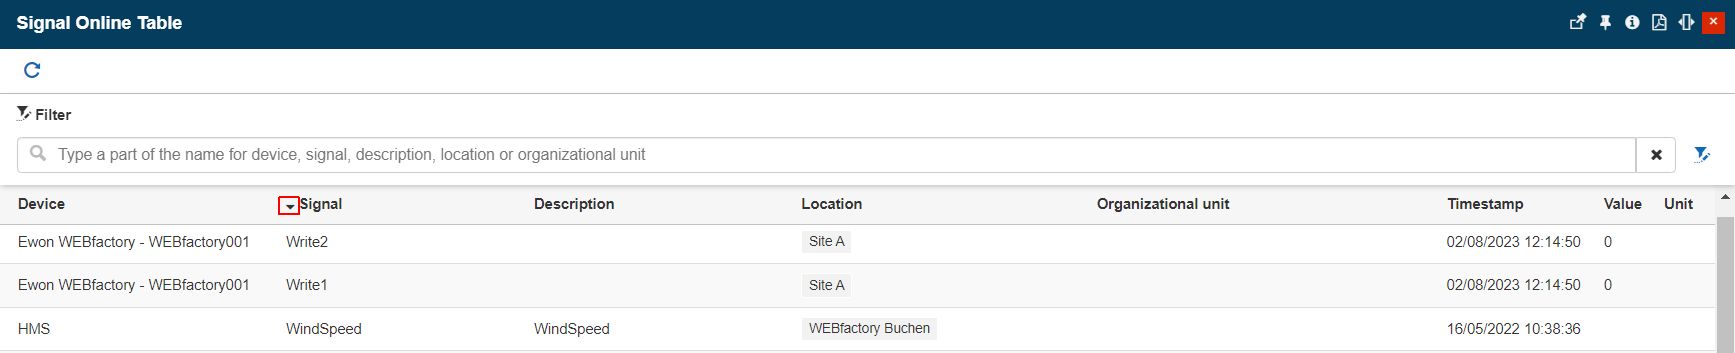
All columns can be sorted ascendingly or descendingly in alphabetical order by clicking the column header. An up/down pointing arrow will be displayed for the column that was last sorted.
The Open filter button opens the Object filters panel. For more details about the Object filters panel, please visit the dedicated article, here.
In this view, the user can select one or multiple entities, up to four, (Organizational Units, Sites, Areas, and/or Devices) to apply their Signals to the panel view. This filter works like a bulk selection of Signals, providing an analysis of all the Signals belonging to the selected hierarchical entity /entities.
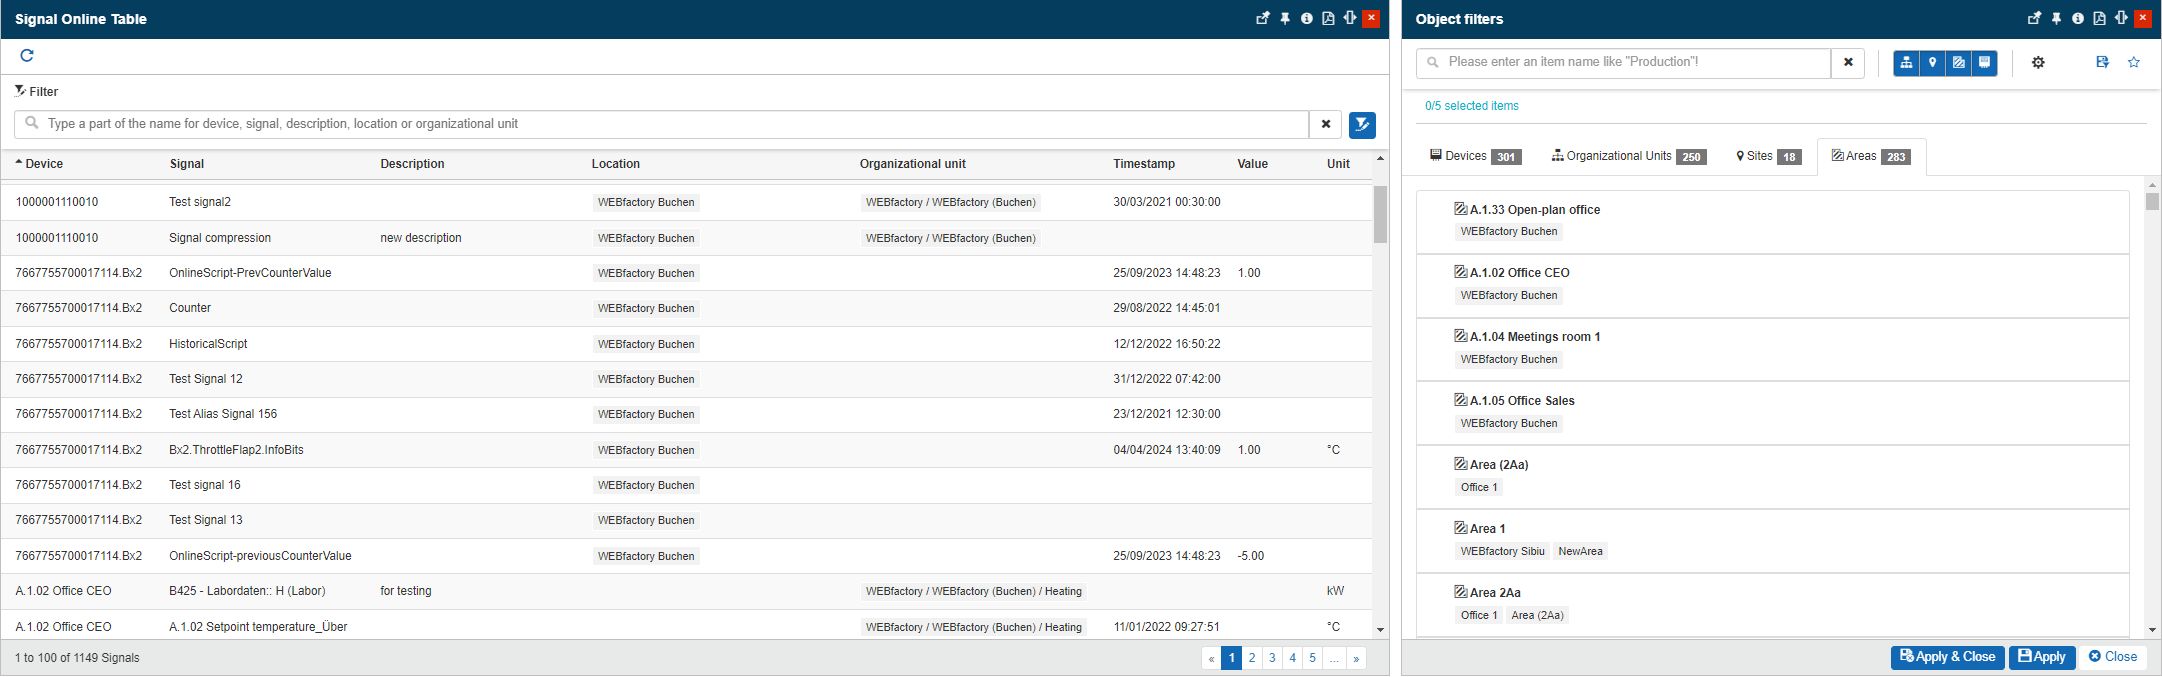
The Open filter button and the Object filters panel
Warning
Please note that the Object filter does not limit the number of selected Signals. It will apply to all the Signals used by the selected entity.
To apply the selection to the panel, the user needs to press the bottom Apply and Close / Apply buttons.