Overview Consumption
The Overview Consumption Analysis functionality portal displays the total consumption of a Customer's Site, Organizational Unit or Area, on a monthly basis.
This article describes the functionality and operation of the Overview Consumption panels from the i4connected portal.
The Overview Consumption analysis functionality of the i4connected portal displays the total consumption of a Customer's Sites, Organizational Units or Areas, on a monthly basis, with the ability to break down the consumption in the particular KPIs that compose it.
The Consumption tile is available in each media section of the portal and opens the Detailed consumption panel.
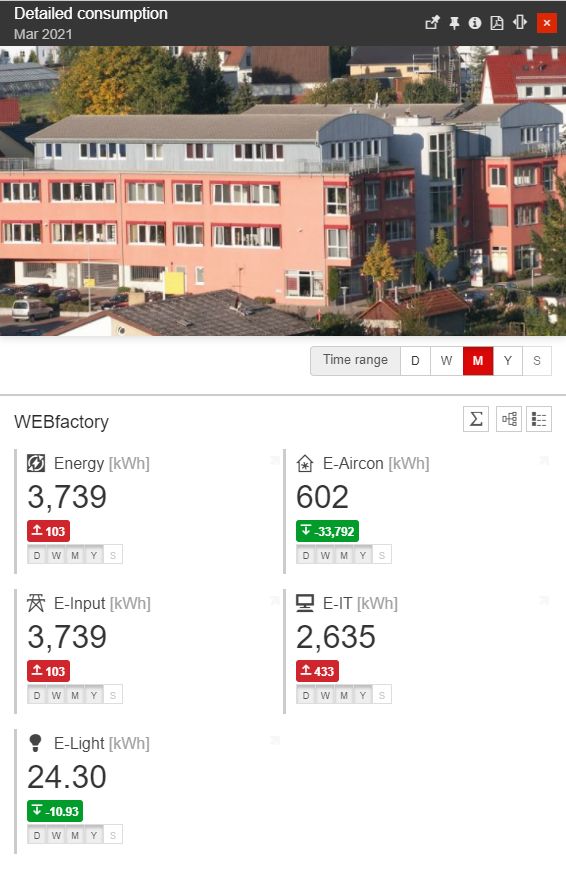
The Detailed consumption dashboard
The Detailed consumption panel displays the current media consumption of the available object, split up in tiles presented as detailed cards providing information about the following aspects:
the consumed media type (with symbol, name and unit)
the current consumption (the consumption from the previous complete month). This value represents the aggregated measurements of the same media/KPI from all the Object children.
the difference between the current consumption in comparison with the previous month and the goal (the month before the previous month). If the goal has been achieved, the value is highlighted in green color. Otherwise, a red highlight is applied.
The time periods for which data is available.

Detailed consumption cards
The Detailed consumption panel allows the user to organise the following operations:
Select the desired Time range - As the Detailed consumption panel uses a tile-based layout, the available tiles display the consumption for a selected time period. The user can select the desired Time range, choosing from the following options:
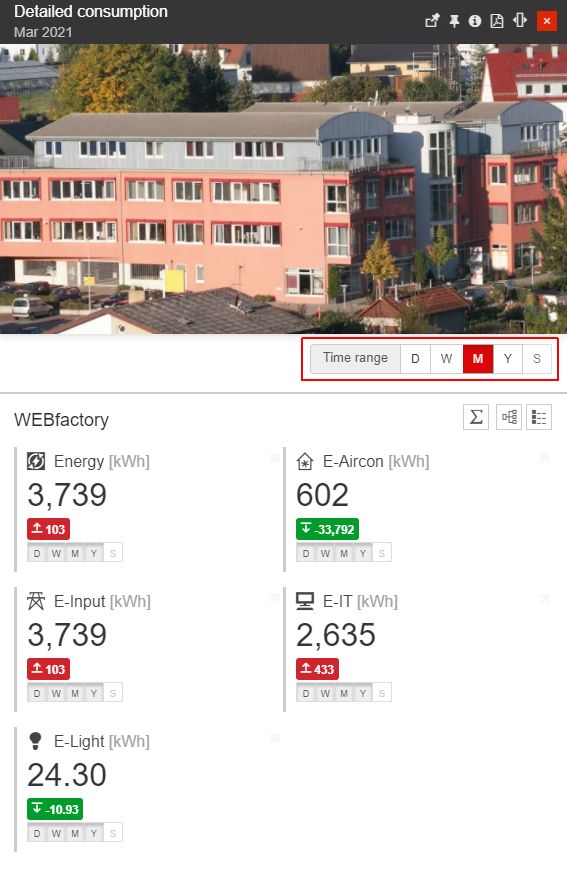
The Time range selectors
D - calculates and displays the measurements registered within the last 14 days.
By selecting the Days range, the consumption chart will be plotted by day, displaying the measurements registered within the last 14 days. Each chart bar will represent one day. By selecting a chart bar, the consumption breakdown chart will be opened, illustrating the measurements registered during those specific 24 hours.

W - calculates and displays the measurements registered within the last 15 weeks.
By selecting the Week range, the consumption chart will be plotted by week, displaying the measurements registered within the last 15 weeks. Each chart bar will represent one week. By selecting a chart bar, the consumption breakdown chart will be opened, illustrating the measurements registered during those specific 7 days.

M - calculates and displays the measurements registered within the last 15 months.
By selecting the Month range, the consumption chart will be plotted by month, displaying the measurements registered within the last 15 months. Each chart bar will represent one month. By selecting a chart bar, the consumption breakdown chart will be opened, illustrating the measurements registered during that month.

Y - calculates and displays the measurements registered within the last 10 years.
By selecting the Year range, the consumption chart will be plotted by year, displaying the measurements registered within the last 10 years. Each chart bar will represent one year. By selecting a chart bar, the consumption breakdown chart will be opened, illustrating the measurements registered during that year.

S - calculates and displays the measurements registered within the last 15 months. In this context, "S" stands for "shift consumption".
Tip
For more details about the management of Shifts, please also check the dedicated article, here.
Each tile (which is configured to do so) will display the time ranges when data exist. The KPIs that do not have data available for a particular time range, are greyed out in the tile's indicator.
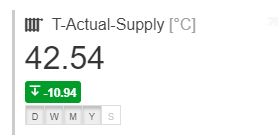
Consumption tile
Select the desired measurement group - The Detailed consumption panel allows the user to select the measurement group using the Measurements group button
 . The icon displayed by this button, reflects the icon assigned to the currently used measure group.
As soon as the Measurements group button is clicked, the view is expanded to display the Transmission settings area. In this view, one or multiple measurement groups can be displayed.
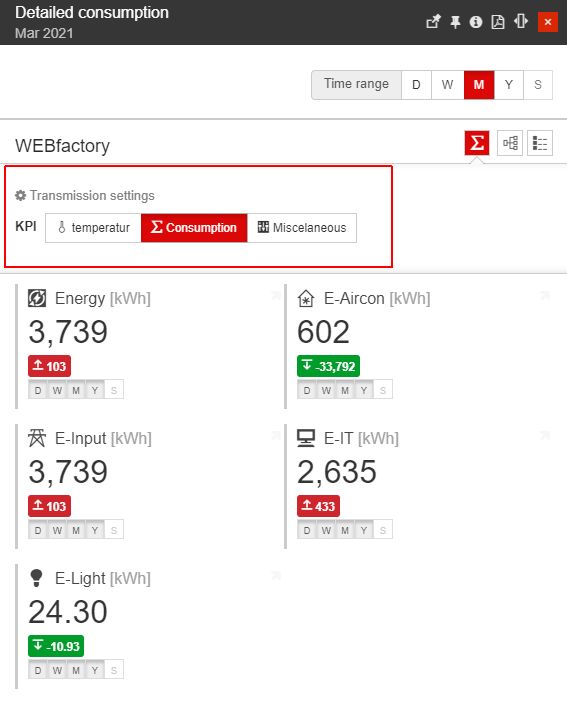
The Transmission settings area
Note
The measureTypeIds and selectedMeasureGroups UI panel parameters only allow the selection of one entity, at a time.
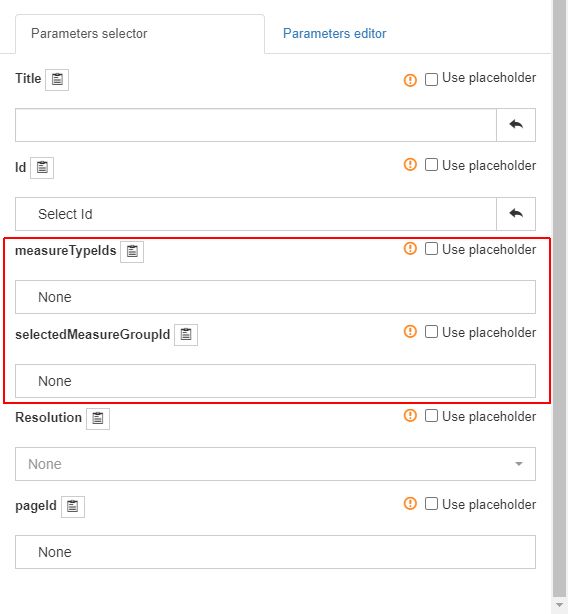
The Overview panel parameters
Therefore, the system administrator can enable the display of multiple measure groups, by editing the feature.Overview.MeasureGroups database setting, available under the Settings table, and making sure that the measureTypeIds and selectedMeasureGroups UI panel parameters are set to value None.

The feature.Overview.measureGroups setting
When multiple measure groups are available for selection, in the Transmission settings area, the user can only select one, at a time. By changing the measure group selection, the data reflected by the measurement tiles will be automatically updated.
View consumption of the Objects' children - By clicking the Drill-down button
 /
/  , the current Object panel is opened displaying the list of subordinated children, along with their detailed consumption data.
Warning
By default, the measurement tiles displayed for the Object's children, are calculated on basis of the Measure group selected for the parent object. The user can switch the measure group of a child, using the Transmission settings area.
Depending on the Measure aggregations to which the Object's children are assigned, the Transmission settings area will only display the available KPIs.
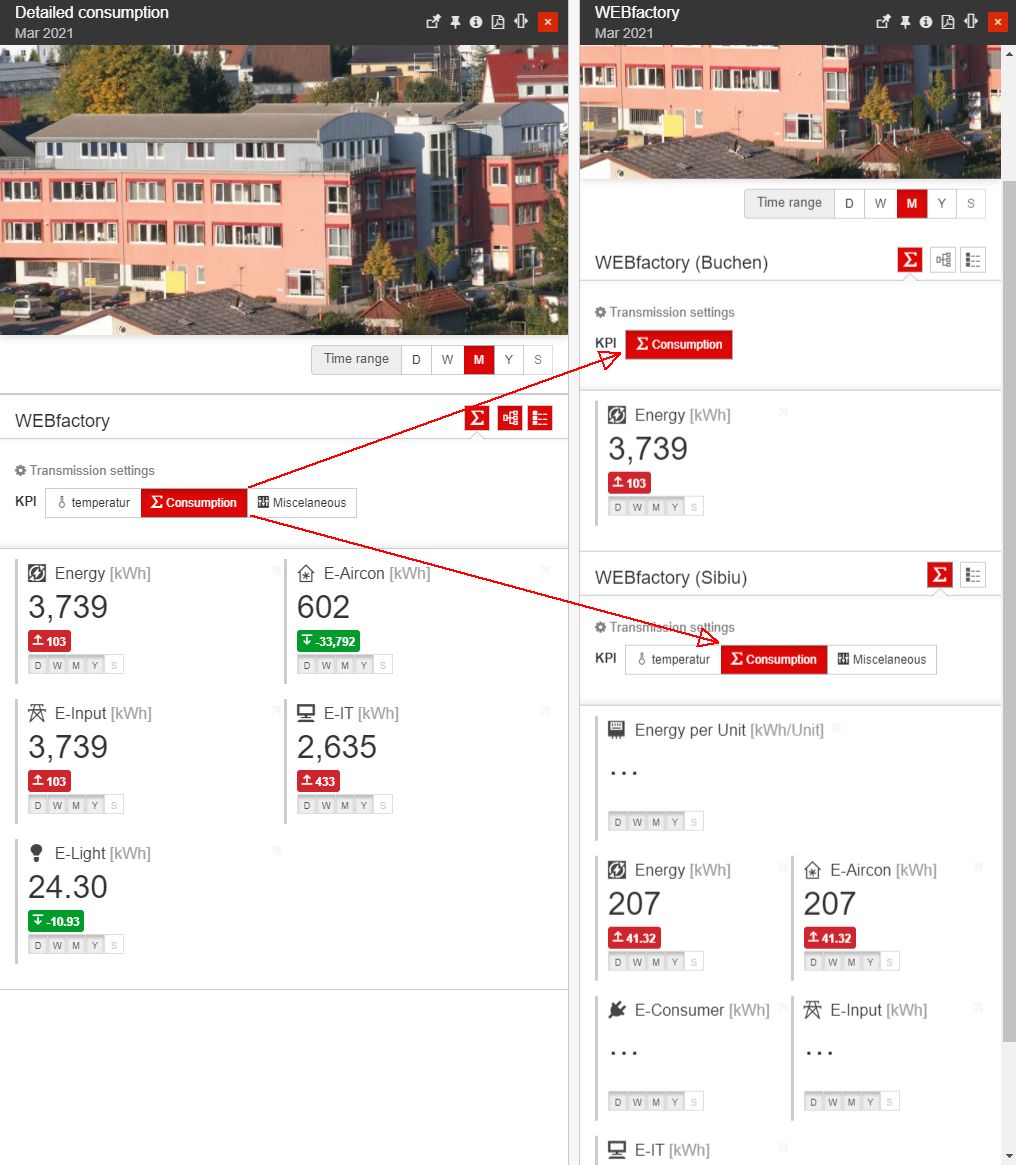
Example with children being assigned to different aggregations, showing different Transmission settings.
It can also be the case when a child is not assigned to an aggregation to which the parent is assigned. Therefore, the child will not be displayed in the drill-down panel.
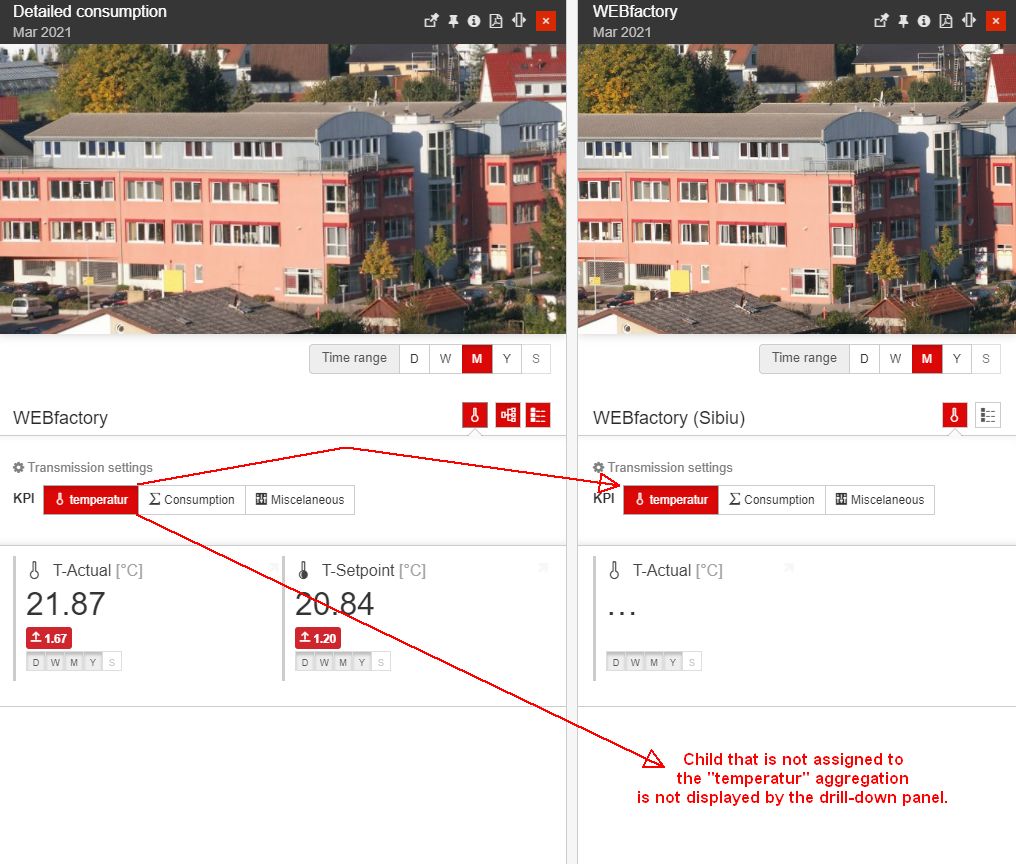
Example with child excluded from the drill-down panel, since the applied aggregation returns no data, for it.
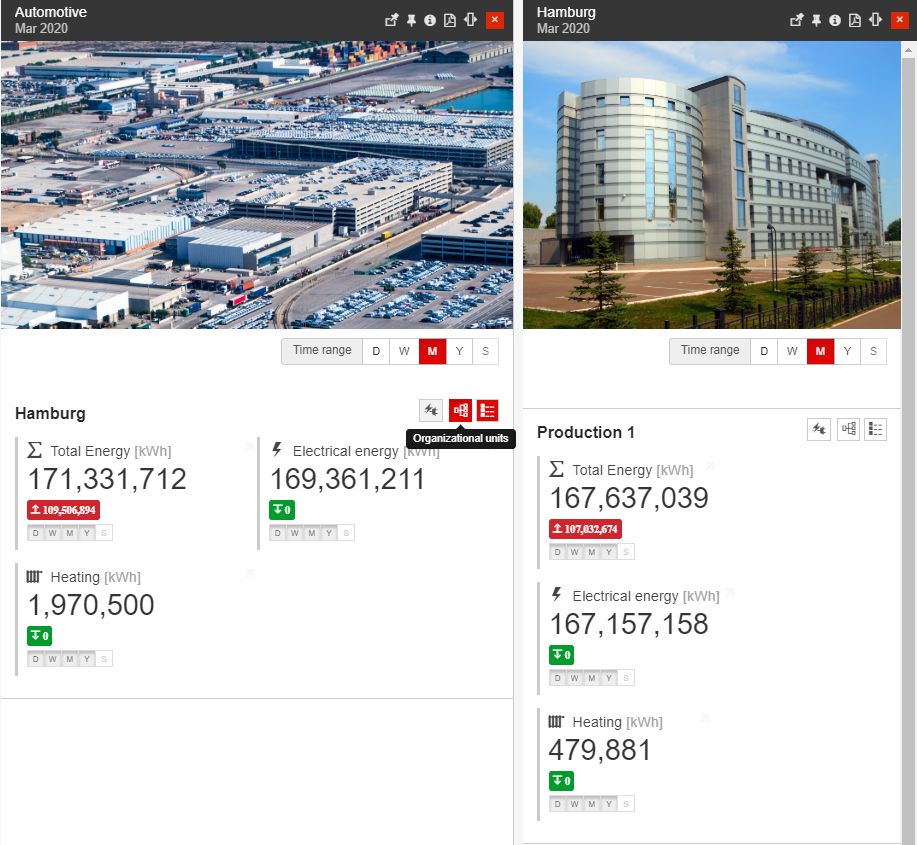
The Drill down panel
The user can open drill-down panels for the Object's children until reaching the bottom of the hierarchy. Each drill-down level is opened in a similar panel that has the same properties as the main Detailed consumption panel.
The toolbar provides the user with the possibility to open the Object's detailed view mode, in a separate panel, where further management operations can also be processed.
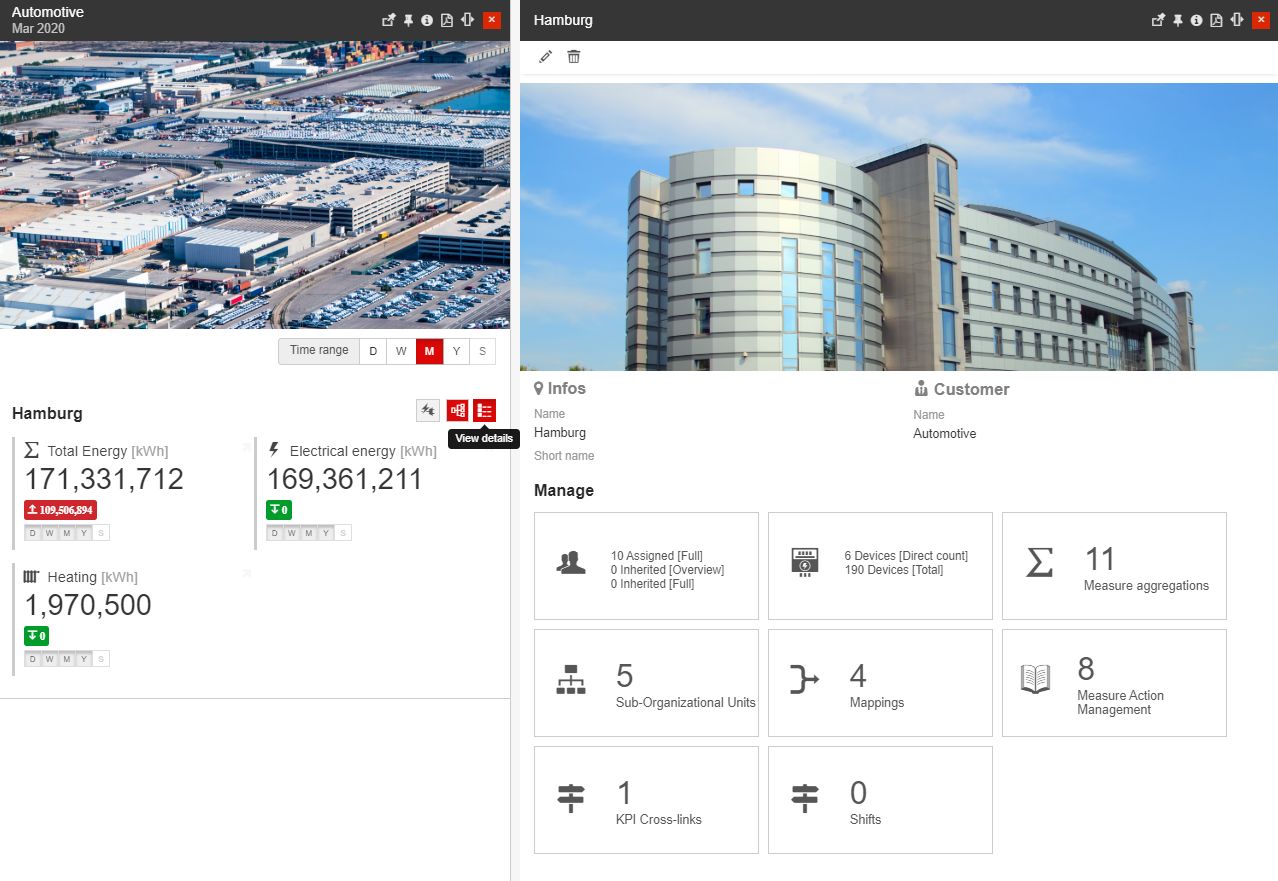
The Objects detailed view mode
Tip
For more details, regarding the Objects detailed view mode, please also visit the following articles: Sites Management, Organizational Units Management, and Areas management.
The consumption chart
To open the detailed Consumption chart in a separate panel the user can click on the tiles. The displayed data depends on the measurement group and the time period preselected for the consumption data. By default, the chart displays the consumption of the first available KPI of the selected measurement group.
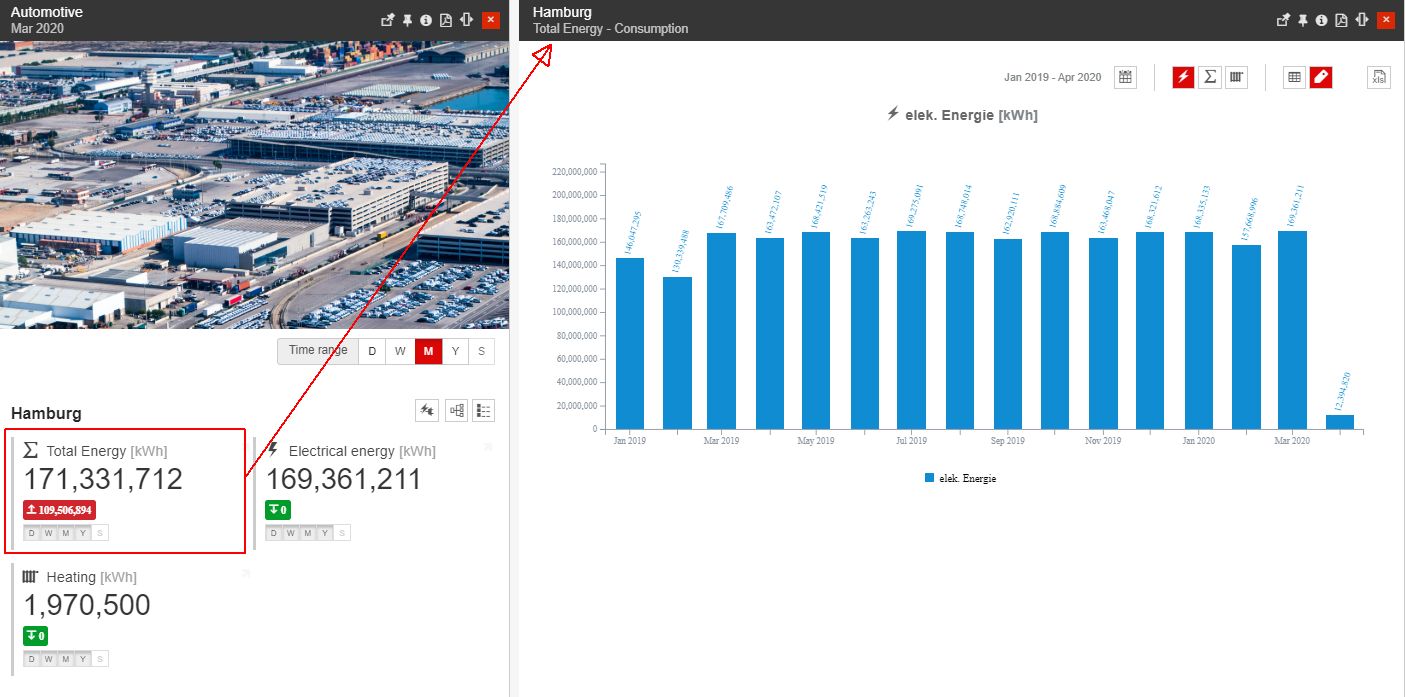
The Consumption chart
The toolbar of the Consumption chart provides the following options:
The Calendar button - opens the calendar menu which allows the user to select a different time range for displaying the consumption data.
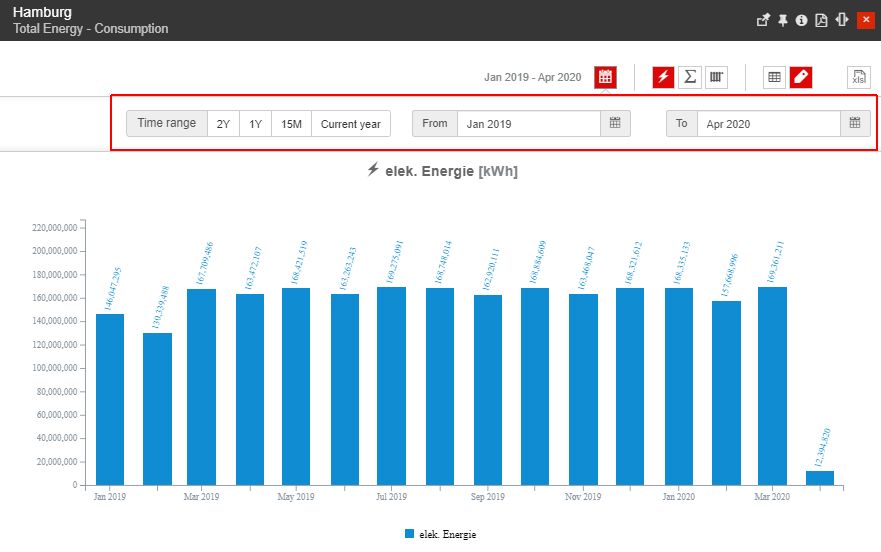
The Calendar button
The Time range options offer four predefined time span values: 2Y - the last 2 years, 1Y - the previous year, 15M - the last 15 months, and the Current year.
The From and To time pickers allowing the user to manually select a time range.
The KPI selectors automatically change the chart data, breaking down the consumption to reflect the selected KPI.
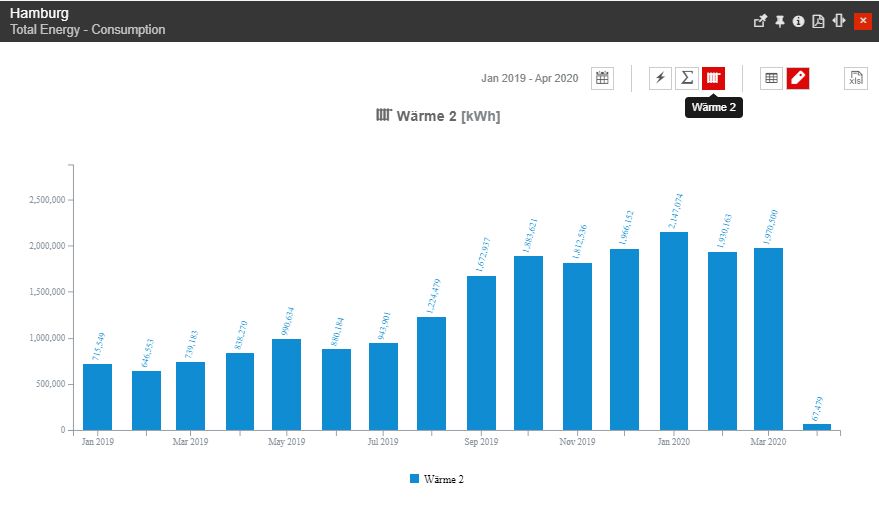
The KPI selectors
The Show Table button toggles the display of data in a tabular format, below the chart.
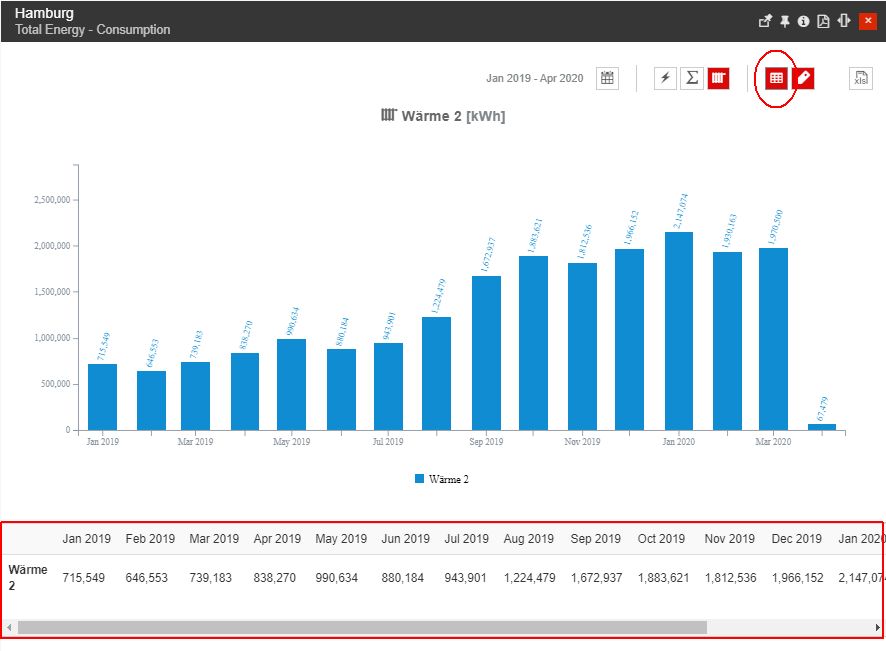
The Show table button
The Show labels button toggles the display of the value labels in the chart.
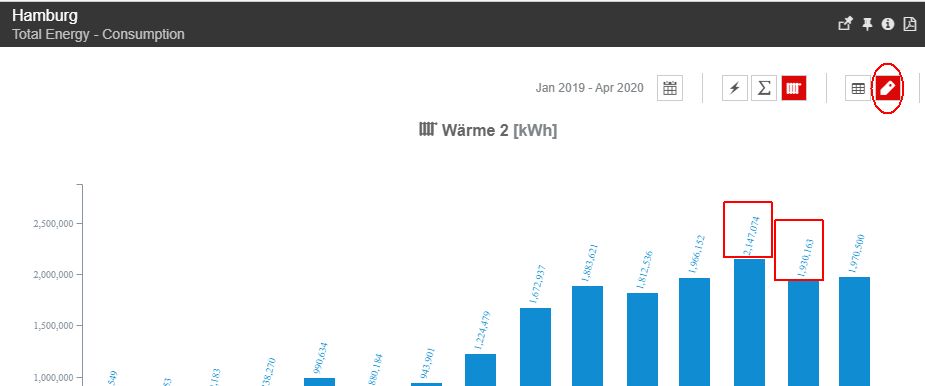
The Show labels button
The Export XLS button exports the data displayed in the chart to an Excel format.

The Export XLS button
The chart displays the data on a horizontal time axis, marking the days/weeks/months or years, depending on the Time range selected in the consumption panel. The value axis is represented vertically.
Hovering the chart bars, a tooltip indicates the respective month and the consumption value of the KPI.
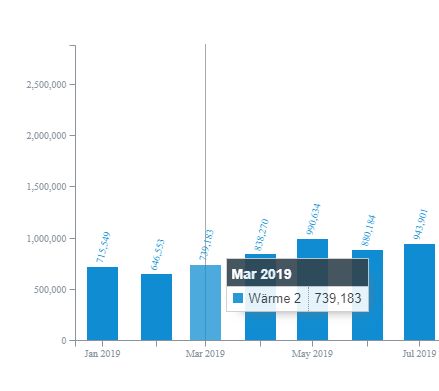
The chart bar tooltip
When clicking a chart column, the Consumption Breakdown panel is opened. This panel shows the total consumption, broken down in individual KPIs.
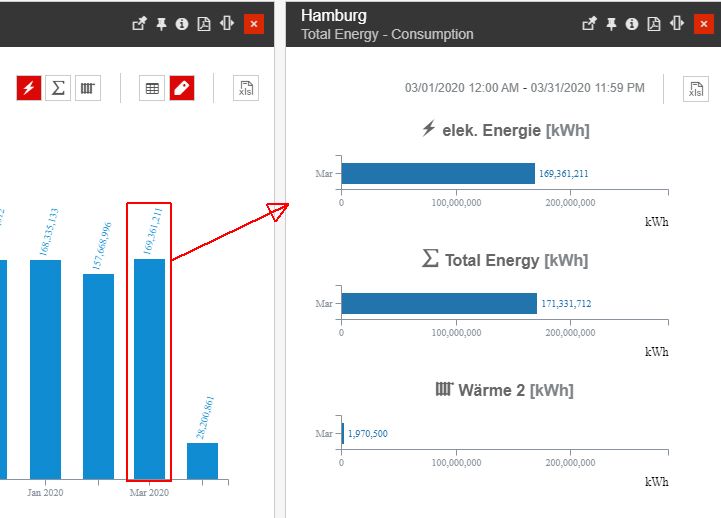
Opening the Breakdown Consumption panel
The Consumption Breakdown panel lists all the available KPIs, their individual consumption values and also provides the option to export the broken-down data, to an XLS file.
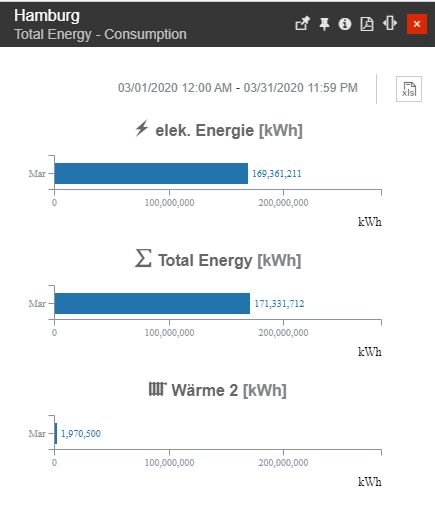
The Breakdown consumption panel
Note
The individual KPI charts will be displayed for all the KPIs, regardless if consumption values exist or not.