Target Achievement
The Target Achievement panel summarises the relationship between the energy consumption goal and actual energy consumption.
This article describes the Target Achievement panel from the Energy section of the i4connected portal.
The Target Achievement panel summarizes the relationship between the energy consumption goal and actual energy consumption, for a given organizational unit or any of its component organizational units.
The Target Achievement panel
This panel can be accessed using the dedicated tile, inside the Energy section of the i4connected portal.
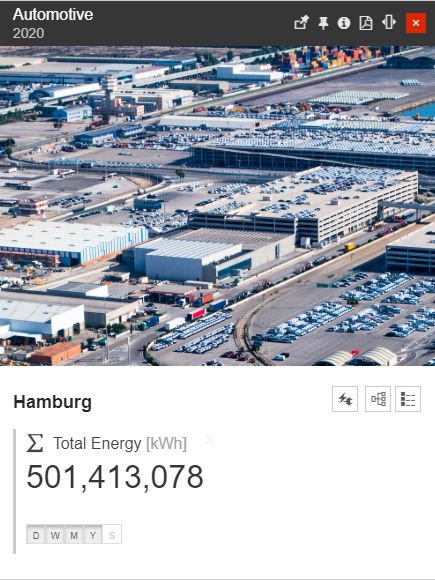
The Organizational Unit panel
The main panel displays the main organizational unit(s) of the customer, providing data upon the energy consumption in a tile-based view. Each tile provides the following information:
The Org Unit Energy Consumption tile
the consumed media type (with symbol, name, and unit)
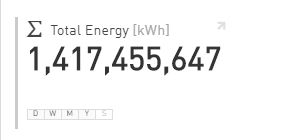
the current consumption value, calculated for the current year
the difference between the current consumption (previous month) and the goal (the month before the previous month). If the goal has been exceeded, the exceeded value is displayed in a red highlight, otherwise, the green highlight is displayed.
the time periods from which the data is available.
At the top of the Organizational Unit tile, the user can organize the following options.
The Media and KPI selectors allow the user to choose which measure aggregation or KPI is factored in when plotting the goal-to-consumption relation. By default, the first measure group is selected (Consumption in this case).
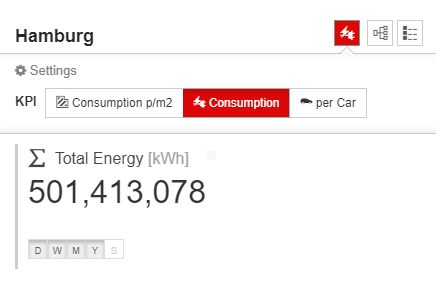
The Media and KPI selectors
The Organizational Units drill-down navigation button allows the user to open another panel where all the children of the current Organizational Unit are displayed. By this, the user obtains a granular overview of the goal-to-consumption relation, which can be plotted for each component organizational unit.
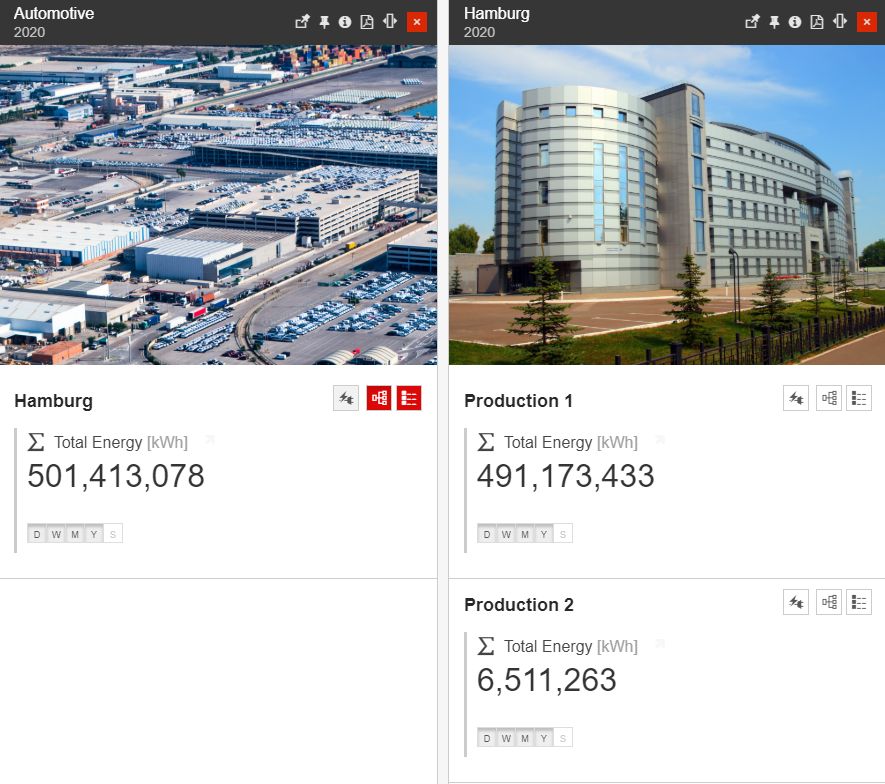
The Organizational Units drill-down panel
The current Organizational Unit drill-down navigation button that allows the user to open the current Organizational Unit in detailed view mode.
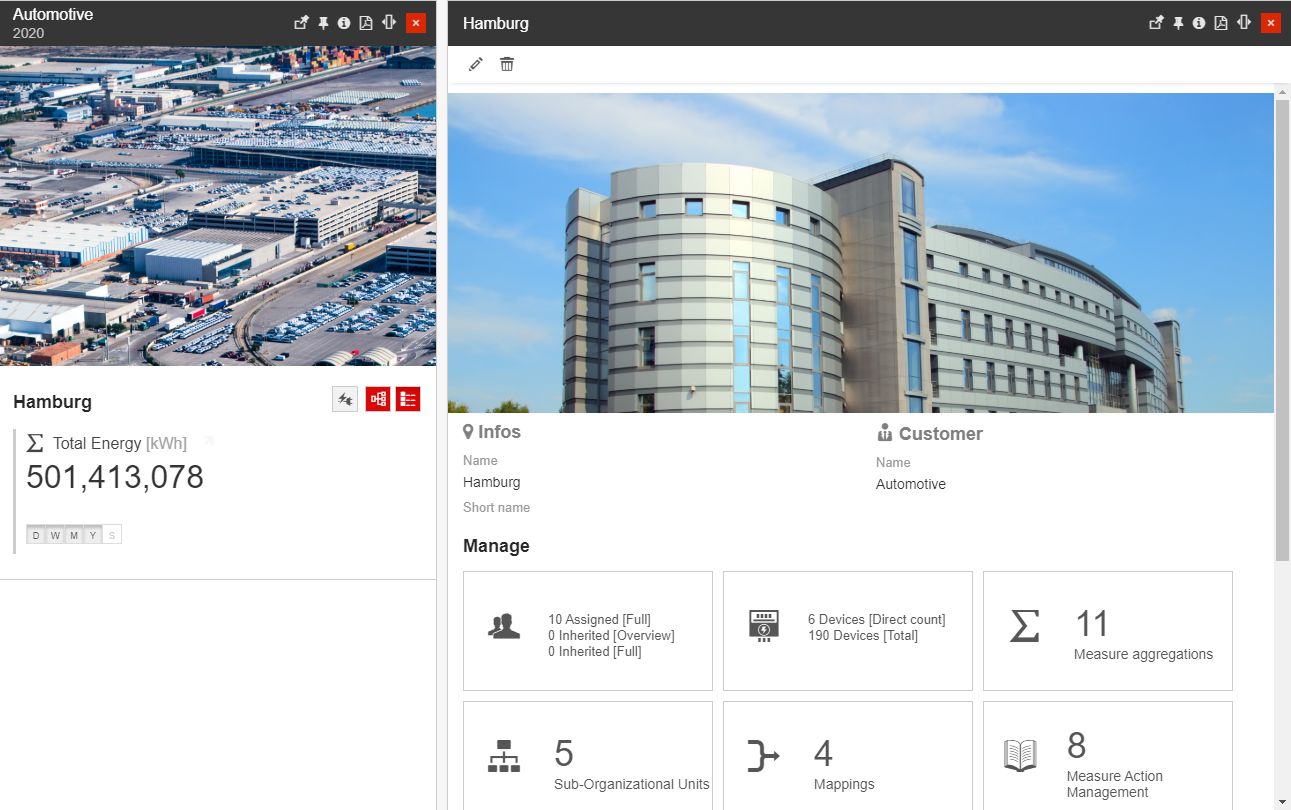
The Organizational Unit detailed view mode
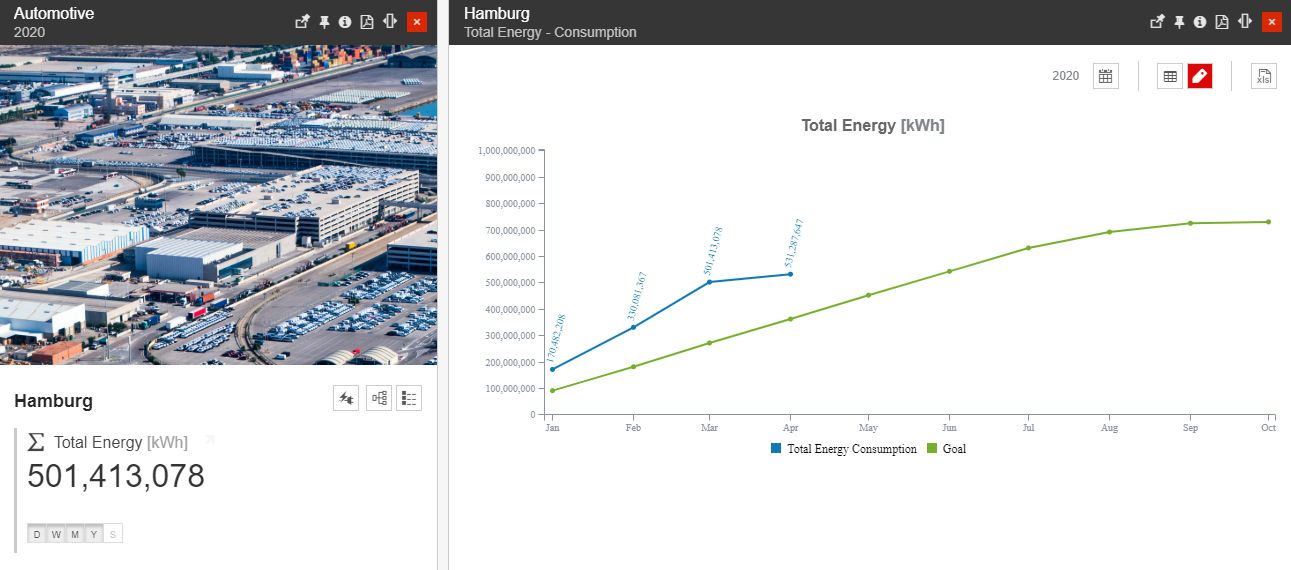
The Energy Efficiency Chart
By clicking on the value tiles in the previously described panel, the Energy Efficiency Chart panel is opened.
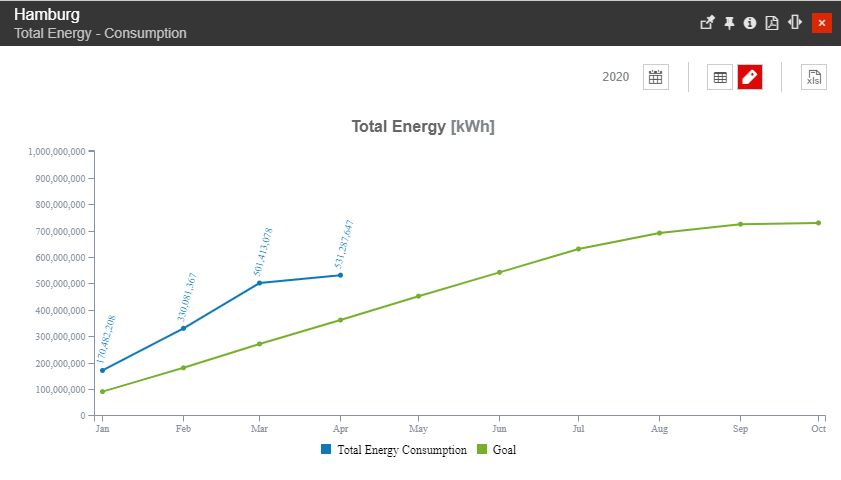
The Energy Efficiency Chart panel
The Energy Efficiency Chart plots the evolution of the accumulated consumption versus the accumulated goals for the current year. The chart's tooltip will display the detailed values for each month of the year.
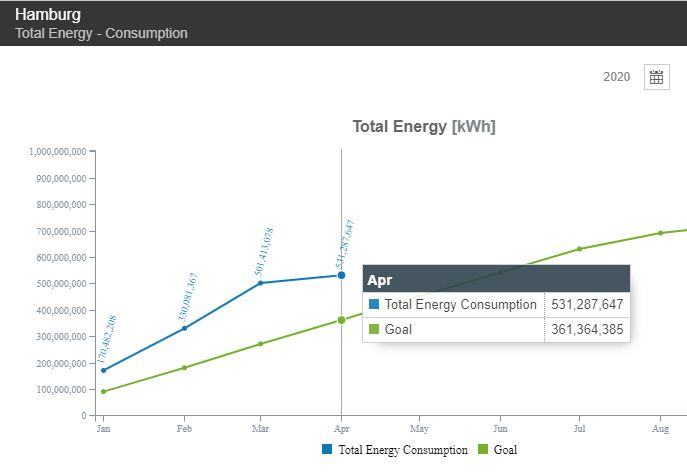
The chart for Energy Efficiency
The Energy Efficiency Chart provides the user with the following options:
the Time frame selectors:
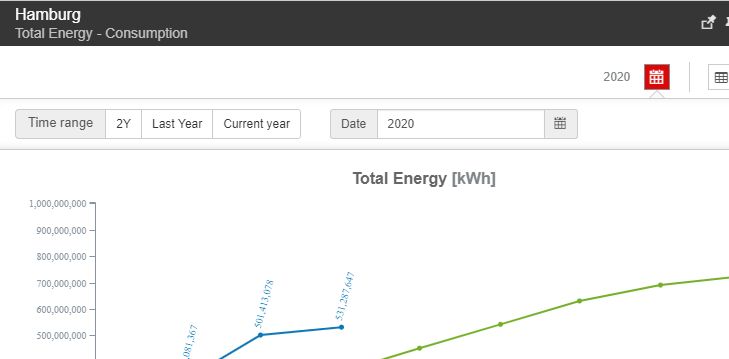
The Calendar button
Time range - allows selection of the following options:
2Y - the last 2 years
Last Year
Current Year
Customized date - allows the user to apply a customized selection, using the calendar view.
the Show table button allows the user to toggle on or off the tabular data display. The data table will be listed under the chart.
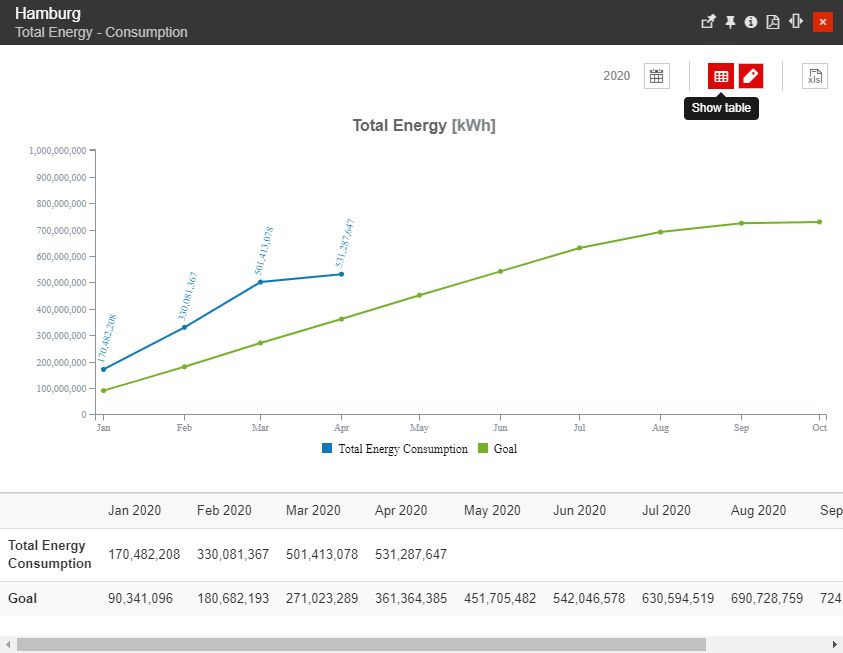
The Show table button
the Show labels button allows the user to toggle on or off the values inside the chart.
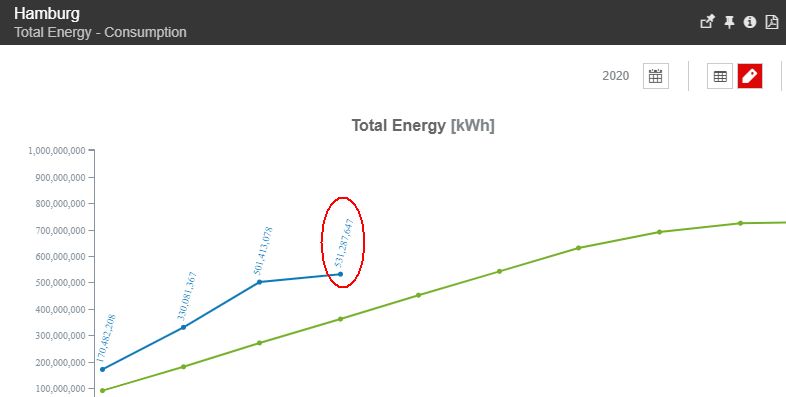
The Show labels button
the Excel Export button allows the user to export the chart data in XLSX format.
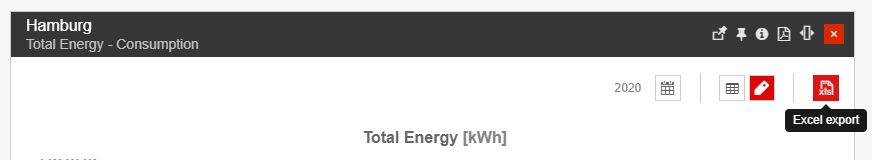
The Excel export button