Event Details Dashboard
The Event Details Dashboard lists the statistical event data in a tabular manner. Check out more details in this article!
This article describes the monitoring functionality of the Event Details Dashboard in the i4connected portal.
The Event Details panel can be accessed from the Event Gantt panel or by using its dedicated tile in the Monitoring section of the i4connected portal.
The Event Details panel
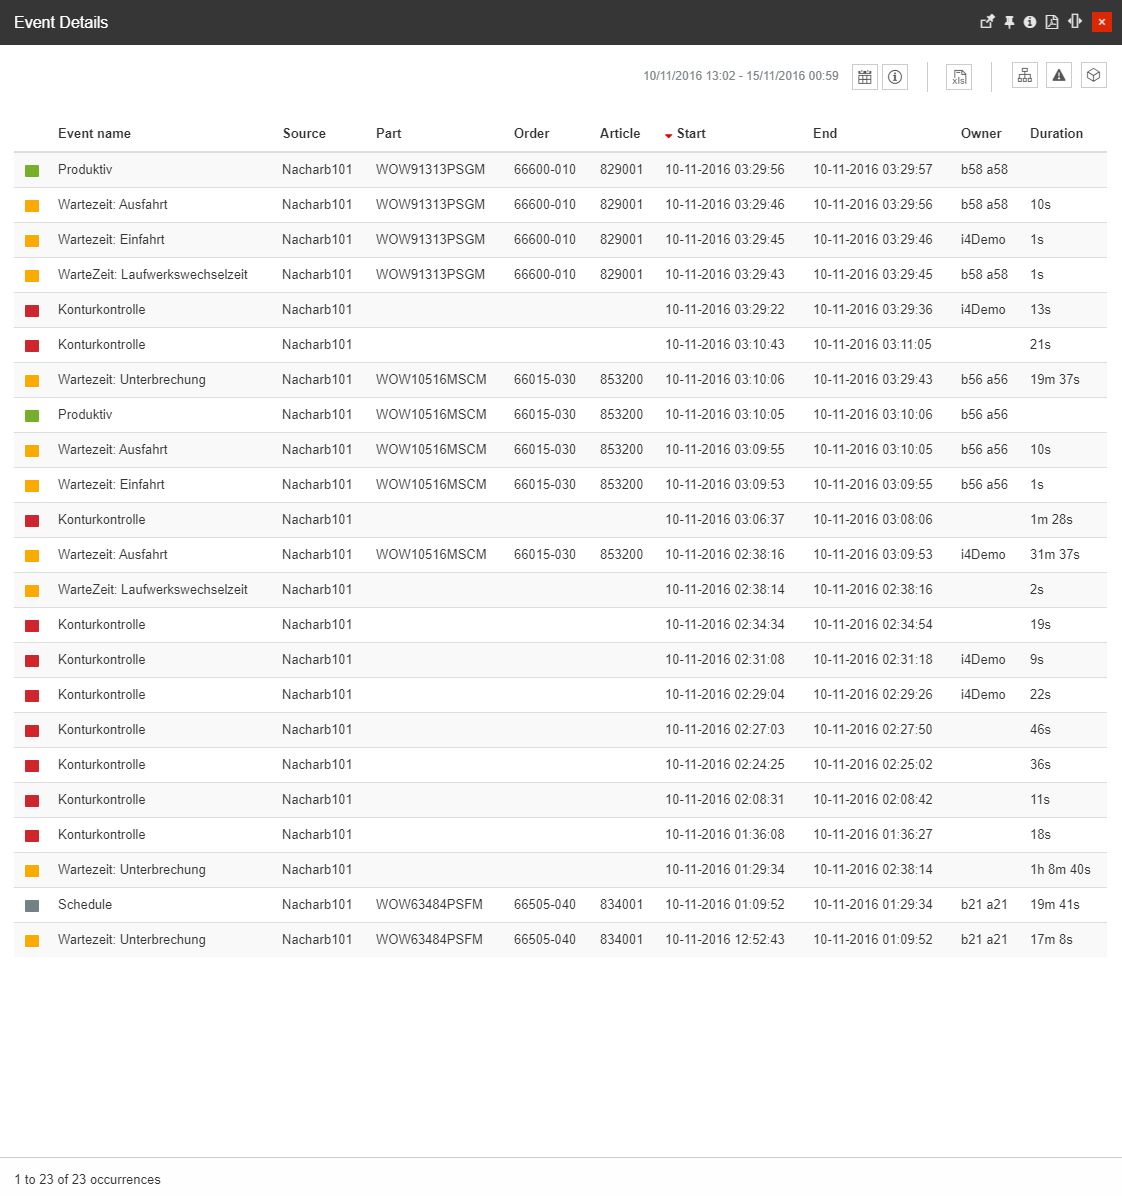
This panel lists the statistical event data in a tabular manner.
The top side of the panel houses the following options that can be tweaked in order to obtain the most complete statistical view of the events:
The timeframe selectors can be accessed by clicking the Calendar button. Here, the user can choose from the following options:
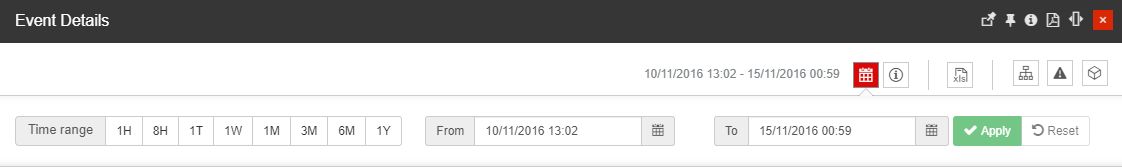
The Calendar button
Time range selectors - provide the user with a set of predefined options:
1H - the last hour
8H - the last eight hours
1T - the last day
1W - the last week
1M - the last month
3M - the last three months
6M - the last six months
1Y - the last year
From / To selectors - provides the user with the possibility to select a customized time frame, selecting the Start and End date and time.
The Information button - opens a legend for the current Event list, providing information upon the event(s) for which the statistics are displayed in the timeline.
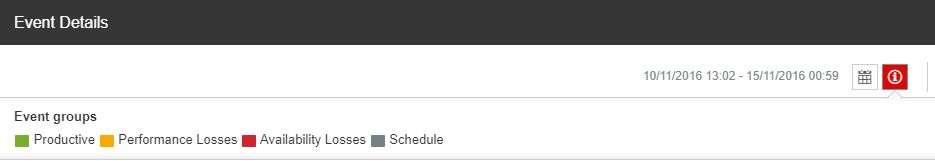
The Info button
The Excel Export button - allows the possibility to export the events table in an XLSX format.
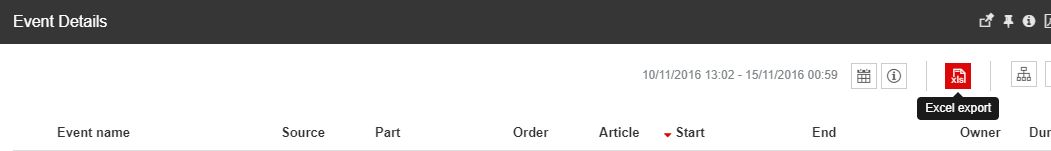
The Export button
The Filter buttons - allows the user to apply the following filters to the list:

The Filter buttons
Objects filter - opens the Object Filters panel, allowing the user to select the Organizational Units, Sites, or Areas where the events are originating. Any filtering done in this panel can be saved and accessed later using the Save filter and Open favorite filters buttons from the right side of the top menu.
Tip
For more details regarding the Object Filters, please also visit the dedicated article.
Events filter - opens the Events filter panel, allowing the user to select the Events, Event Types, and Event Groups.
Tip
For more details regarding the Events Filters, please also visit the dedicated article.
Parts filter - opens the Parts filter panel, allowing the user to select the Parts, Orders, and Articles.
The main section of the Event Details panel is the events table.
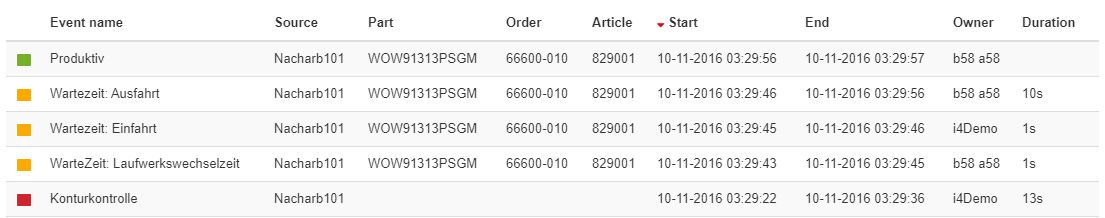
The Events table
The table displays the following event occurrence details:
Event name
Source
Part
Order
Article
Start
End
Owner
Duration
By clicking an event occurrence in the table, the Alarm panel is opened allowing the user to undertake actions for that particular event occurrence.
Tip
For more details regarding the Events management please also read the Events Management articles.