KPIs management
Check out this article to learn more details about the i4connected Key Performance Indicators management.
The KPI (or Key Performance Indicator) is a type of performance measurement. In i4connected a KPI is defined by a combination of measure groups and measure types and has a unique name. Because the Measure Aggregations are, by definition, a unique combination of measure groups and types, one can say that the KPIs with the same combination of measure groups and types belong to that particular Measure Aggregation.
Like the Measure Aggregations, each KPI has two formulas used for calculating its goal and value.
KPIs can be managed by users having the Manage configuration permission enabled, by accessing the Key Performance Aggregation tile. The Key Performance Indicators panel lists the available KPIs and allows the user with the following options:
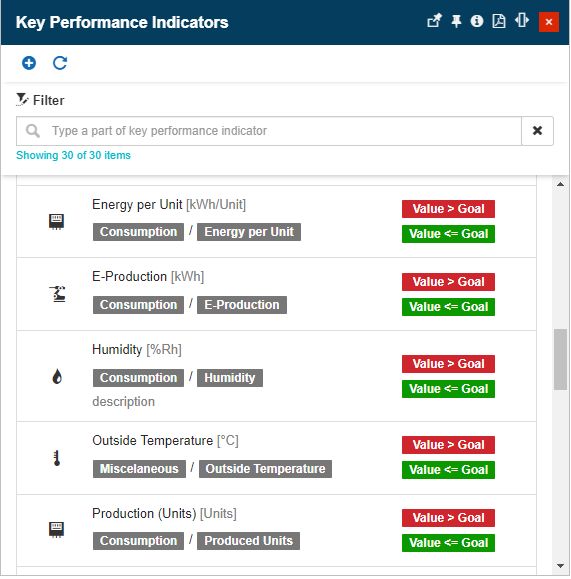
The Key Performance Indicators panel
The list of Key Performance Indicators
The list of Key Performance Indicators is displayed in the panel's central area, like cards in a scrollable list. Each KPI card display the following details:
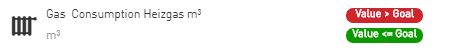
The KPI card
The Measure Type name
The Measure Group name
The KPI Description
The KPI Name
The Unit of measure
The value-to-goal relationship
Important
Unlike the Measure Aggregations, the KPIs must have a unique name. The combination between the measure group and measure type doesn't have to be unique for the KPIs, as more KPIs can belong to the same combination of measure groups and types (or, simpler, more KPIs can belong to the same Measure Aggregation).
Refreshing the list of Key Performance Indicators
The Key Performance Indicators panel features the Refresh button which provides the user with a manual way to reload/update this list.
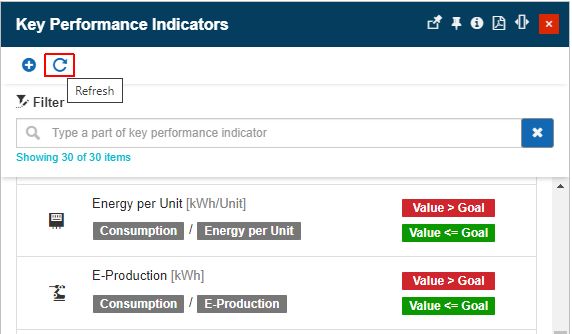
The Refresh KPIs button
Filtering the Key Performance Indicators
Given the fact that the i4connected project can support a large amount of KPIs, the user is provided with a simple search option, allowing the user to filter the list by KPI Name, KPI Description, Measure Group, or Measure Type.
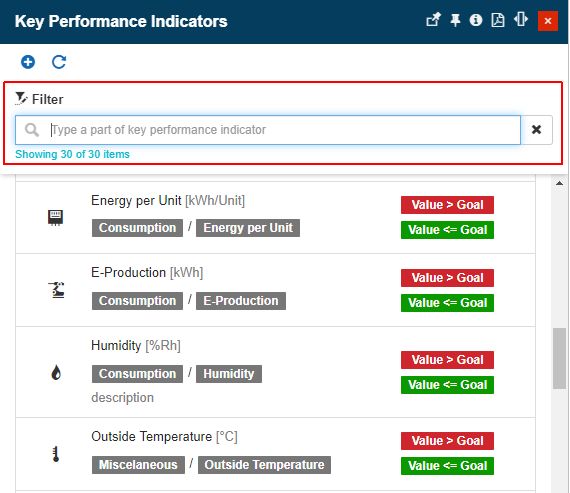
Key Performance Indicators filtered list
Adding Key Performance Indicators
To create a new KPI, the user can click the Add toolbar button. In the Add Key Performance Indicators panel the user can organize the following settings:
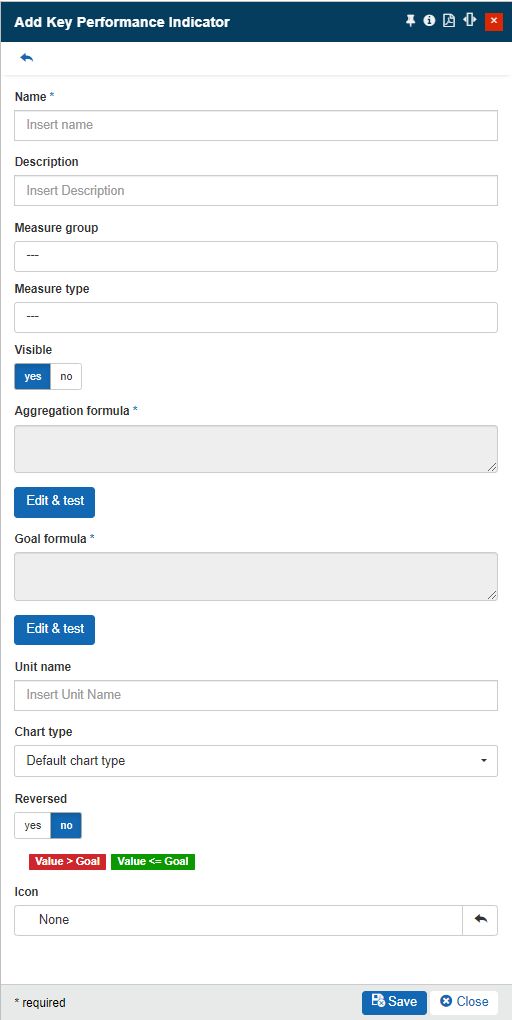
The Add Key Performance Indicator panel
Name (mandatory) - the unique name of the KPI. This name will be used for displaying and filtering the KPIs in all the panels that use them.
Description - the description of the KPI.
Measure group - opens the Measure Groups panel allowing the user to select the desired measure group for the measure group and the type combination, to which this KPI will belong.
Measure type - opens the Measure Type panel allowing the user to select the desired measure type for the measure group and type combination, to which this KPI will belong.
Visible - if the flag is set to No, the KPI will not be taken into consideration in some specific use cases.
Aggregation formula (mandatory) - the formula used for aggregating the values. To add the aggregation formula, click the Edit & test button. This will open the Test Aggregation Formula panel where the formula can be created and tested.
Goal formula (mandatory) - the formula used for defining the goal. To add the goal formula, click the Edit & test button. This will open the Test Aggregation Formula panel where the formula can be created and tested.
Unit name - the unit of the KPI.
Chart type - the type of chart that can be used for the KPI. The user can choose between the following options:
Default chart type - will keep the default chart type used by a chart.
Line chart - will change the chart type to a line chart.
Bar chart - will change the chart type to a bar chart.
Reversed - defines the relationship between the value and the goal. If the Reversed is enabled, the good state, indicated by the green color, will be activated when the value is bigger than the goal, while the bad state, indicated by the red color, will be activated when the value is less than or equal with the goal. The legend on the right side will display the value of the goal relationship.
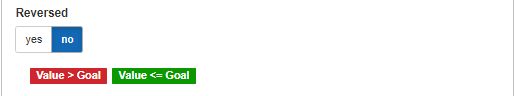
The Reversed setting
Icon - the icon of the KPI. The user can choose from the Select icon panel, opened by clicking the Icon field.
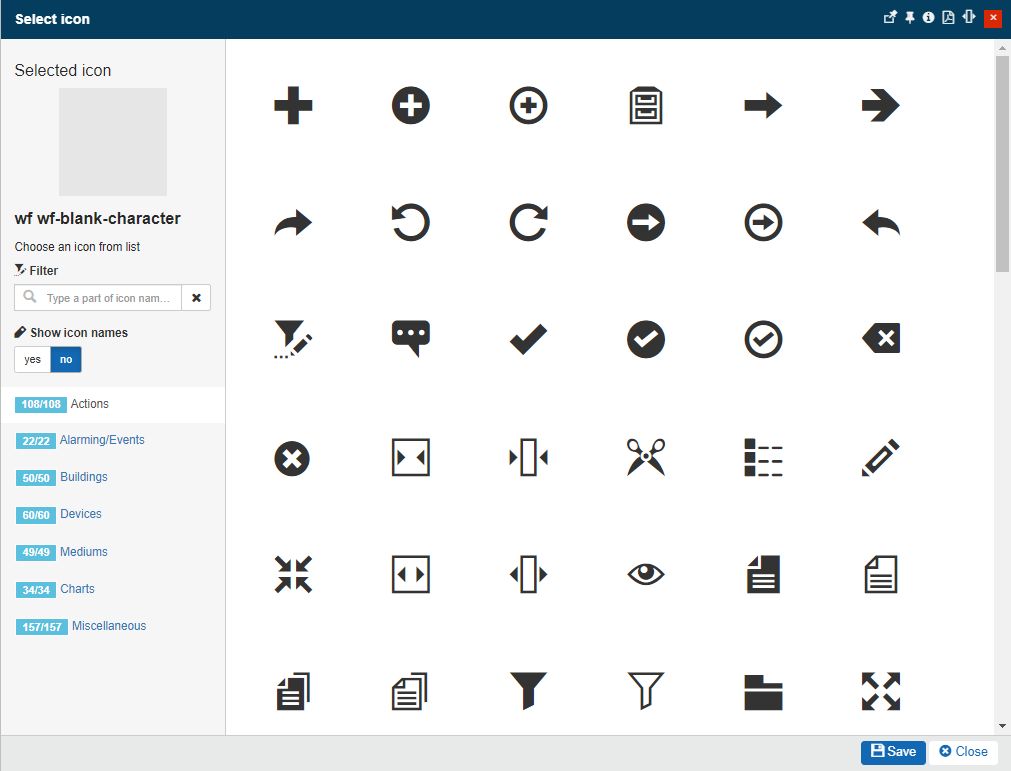
The Select icon panel
Like all the other panels in the i4connected portal, the Add Measure Aggregation panel has validation rules that help the user by checking each field for the required values.
Editing Key Performance Indicators
By clicking a listed KPI the Edit Key Performance Indicator panel is opened. In this view, the user can edit all the details of the Key Performance Indicator.
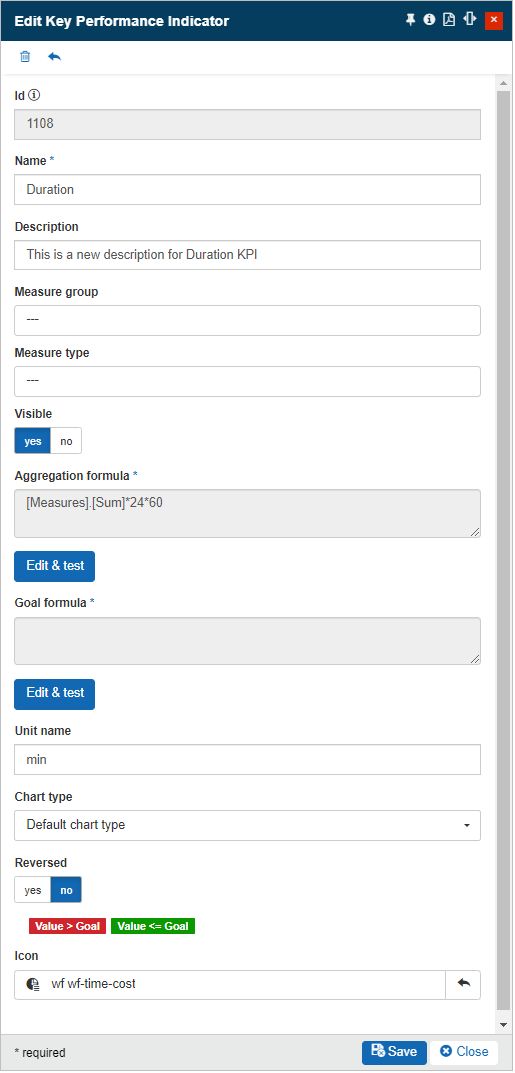
The Edit Key Performance Indicator
Deleting Key Performance Indicators
The Edit Key performance Indicators panel allows the user with the possibility to remove the selected KPI, by clicking the Delete toolbar button.
The Delete KPI button
By clicking the Delete button the Delete Performance Indicator panel is opened. In this view, the user is provided with information about the impact of the deletion on the whole system. To acknowledge the consequences and proceed with the deletion, the user has to type in the designated field, the displayed confirmation code. To proceed with the deletion, the user can press the Delete button, located at the bottom of the panel. Deletion is immediately visible, in the Key Performance Indicators panel.
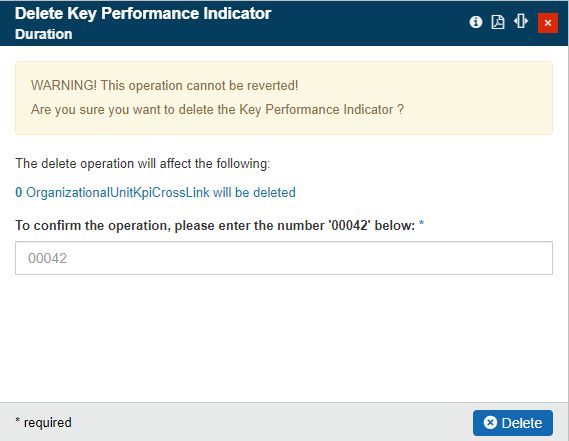
The Delete Key Performance Indicators panel