Measures
The Measures dashboard helps the user to track down the decisions (measures) taken in order to optimize the company's consumption, costs, or benefits.
This article describes the Measures panel from the Overview section of the i4connected portal.
The Measures panel helps the user to track the decisions (measures) taken in order to optimize the company's consumption, costs, or benefits. The measures data is aggregated for the top organizational unit, each child organizational unit contributing to the complete measures overview.
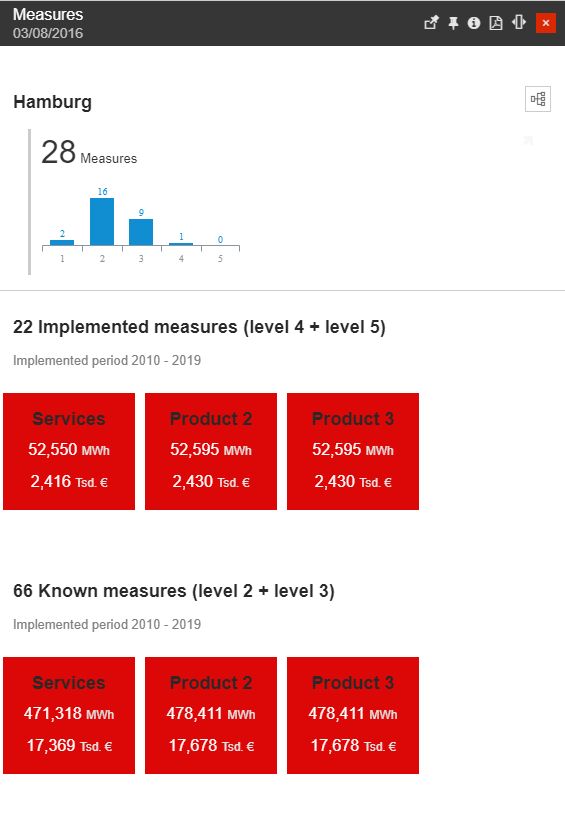
The Measures panel
The Measures panel can be accessed using the Measures tile. The Measures panel displays the total number of measures in stages 1 to 5 for the top organizational unit and the distribution of these measures in each stage, using a bar chart.
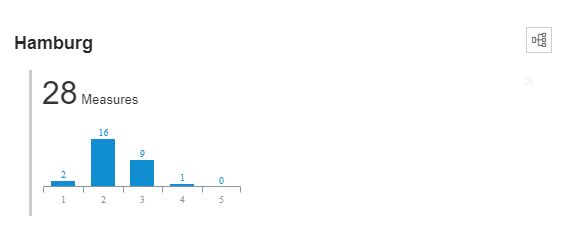
The measures chart
The measures are split in 6 states:
Status 1 - the potential savings are identified
Status 2 - the potential savings are validated
Status 3 - the measure for achieving the potential savings is decided
Status 4 - the measure for achieving the potential savings is implemented
Status 5 - the savings achieved by the measure are confirmed
Status 9 - the measure is uneconomical or postponed
The user can drill down the organizational units that contribute with their associated measures (children organizational units with mapped measures) to the total measures overview displayed by the measures chart.
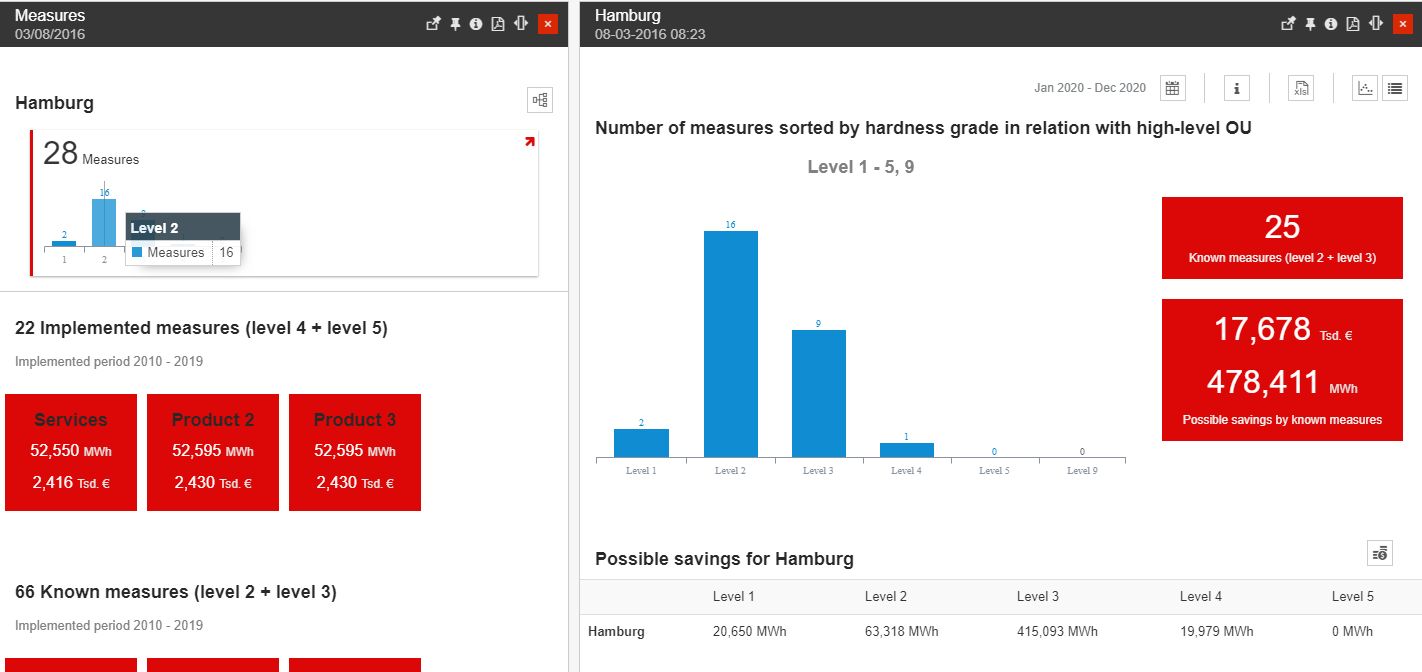
The Measures drill-down panel
Clicking on the measures chart in either the Measures panel or any organizational unit drill-down panels will open the Measures Dashboard panel which provides measure details for the corresponding organizational unit.
The Measures panel also highlights the more critical measures implemented for the top organizational unit (ant its children organizational units):
the measures from the goals start the year with status 4 and 5 (implemented measures) and the totals for consumption and financial savings for each targeted point of interest.
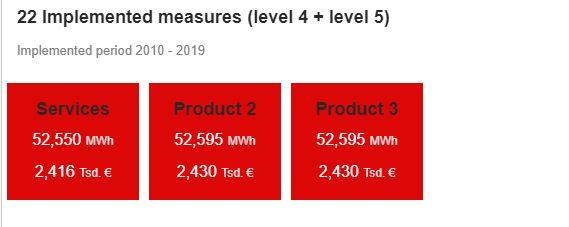
Implemented measures
the measures from the current year up to the goals end the year with the status 2 and 3 and the totals for consumption and financial savings for each targeted point of interest.
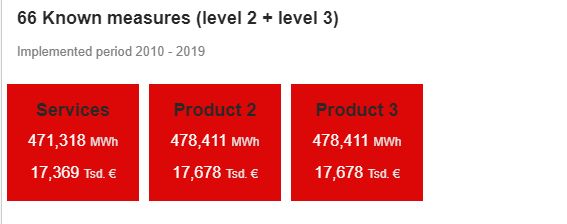
Known measures
The Measures Dashboard panel
The Measures Dashboard panel displays detailed information about the measures affecting the selected organizational unit. If the Measures Dashboard is opened from a child organizational unit, its measures data will be compared with the measures data of the top parent organizational unit.
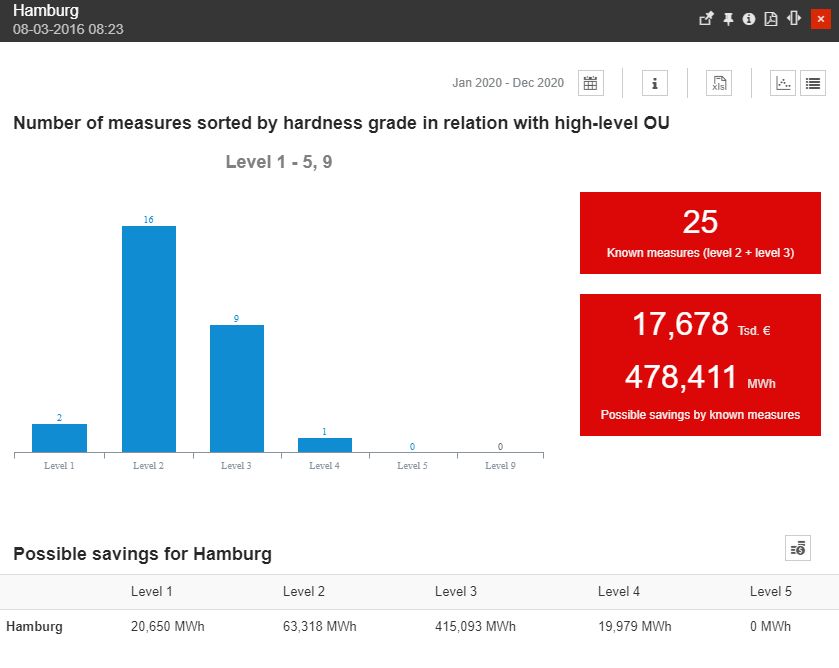
The Measures drill-down dashboard
The Measures Dashboard panel can be opened by clicking the Measures chart in the main Measures panel or in any drill-down panels corresponding to a child organizational unit that contributes to the top organizational unit in the main Measures panel.
The measures data displayed in the Measures Dashboard is divided into three sections:
The stage chart - plots the number of measures in each stage (from 1 to 5 and 9) for the selected organizational unit and its descendent (contributing) organizational units.
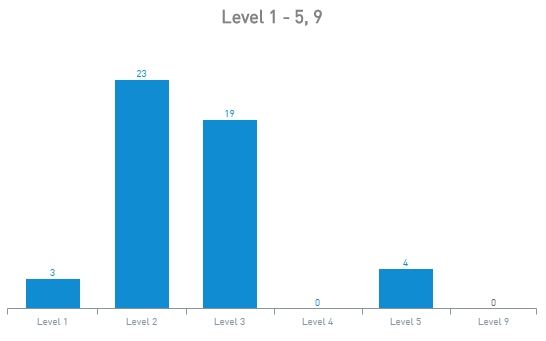
The stage chart
If the selected organizational unit is a descendant of the top organizational unit, the Stage chart will plot the measures data against the top-level organizational unit, using overlapping chart bars.
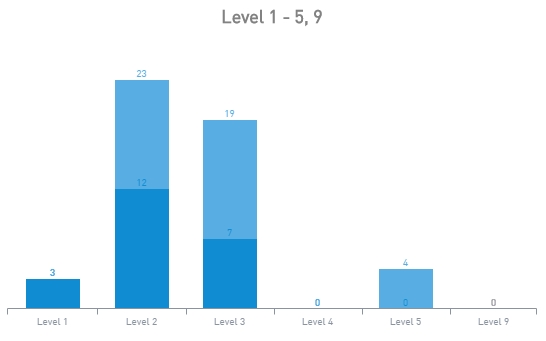
Measures stage chart with parent-child Organizational Units
By clicking a Stage chart bar the Measures Action panel is opened to display all the measures of the selected column.
The total panels are available on the right side of the Stage chart and show the following information:
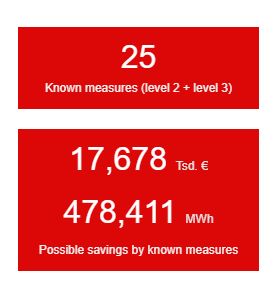
The total panels
the top panel displays the total number of measures in stages 2 and 3
the bottom panel displays the total financial and energy savings for the measures in stages 2 and 3
The savings table is represented at the bottom of the Measures dashboard. In this view, the user can read information upon possible savings for the measures in stages 1 to 5. The displayed information can be toggled between energy savings and financial savings, using the top-right toggle button.

Possible Energy savings table

Possible financial savings table
If the organizational unit is a descendant (contributor) of a top-level organizational unit, the Savings table will display the savings data against the top parent organizational unit.

Possible savings table for parent-child Organizational Unit
The top menu of the Measures Dashboard presents a set of options that allow the user to customize and obtain additional information about the organizational unit's measures, as follows:

The Measures dashboard toolbar
The Time Range selector allows the selection of a customized time range, choosing from the following options:

The Calendar button
Time range - allows a quick timeframe selection: 1Y (previous year) or Current year.
From / To selectors - allows a customized selection of the Start and End date and time.
The Information button enabled the display of an explanation for each level.

The Information button
The Excel export button allows the user to export the Measures Dashboard data into an XLSX formatted file.

The Export button
The Scatter Diagram button allows the user to open the Scatter Diagram panel.

The Chart Scatter button
The Scatter Diagram uses a bullet chart to plot the organizational unit's measures in two-dimensional charts. The X (horizontal) axis represents the number of years and the Y (vertical) axis represents the payback in energy savings (MWh).
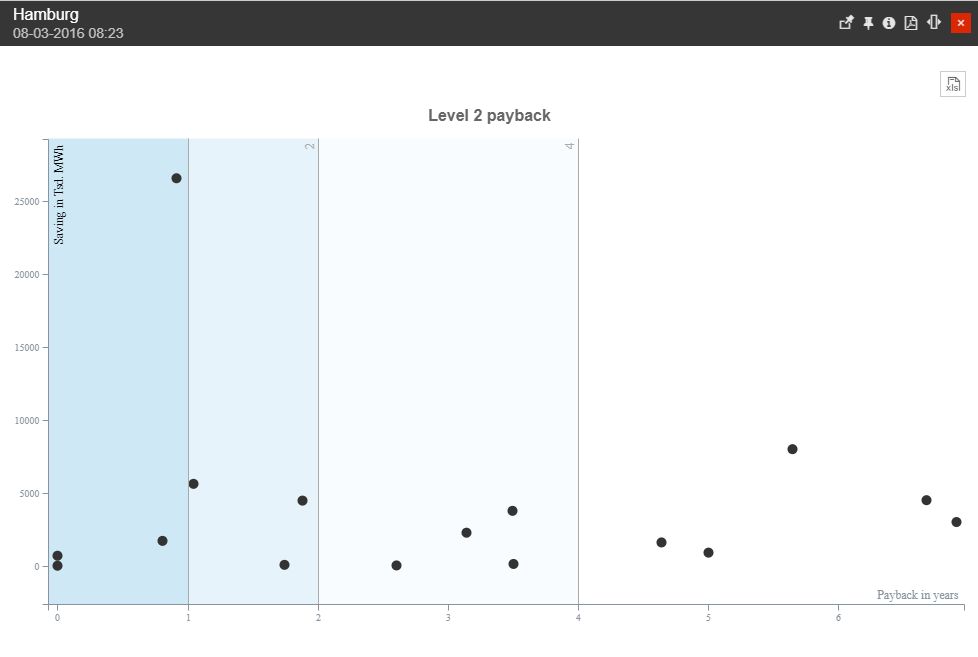
The Scatter Diagram
Hovering over a bullet will open the tooltip panel which displays the measure ID and text as well as the payback in years and savings in energy for that particular measure.
The Scatter Diagram data can also be exported to Excel using the top-right export button.
The Measures Actions button allows the user to open the Measures Actions List panel, where a detailed view of all the measures for the selected organizational unit is displayed.

The Measure Actions list button
The Measures Action panel can also be opened by clicking any bar in the Measures panel's Stage chart. In this case, the Measures Action panel will be by default filtered to only display the measures shown by the chart bar that opened the panel. All the measure data displayed by the Measures Action panel can be exported to Excel using the top-right export button.
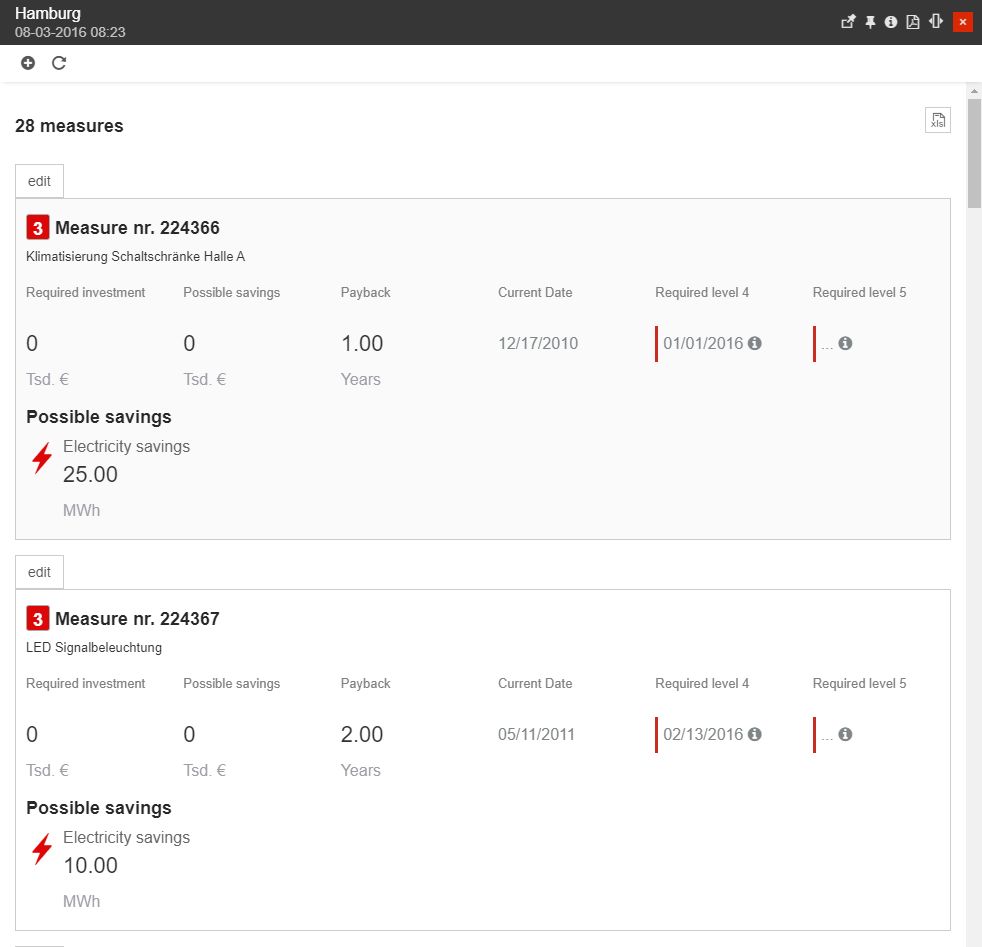
The Measure Actions panel
The user can add new Measure Actions by clicking the Add action toolbar button. The Add action panel provides the following properties:
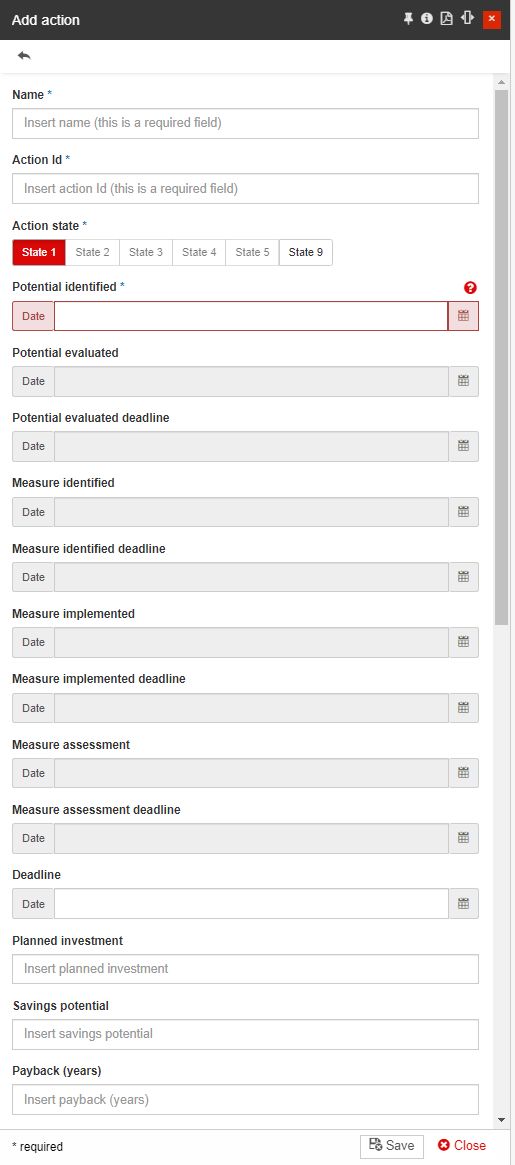
The Add action panel
Name of the new action *
Action Id *
Action state *
Potential identified *
Potential evaluated
Potential evaluated deadline
Measure identified
Measure identified deadline
Measure implemented
Measure implemented deadline
Measure assessment
Measure assessment deadline
Deadline
Planned investment
Savings potential
Payback (years)
Current situation
Target situation
Notes
Calculation notes
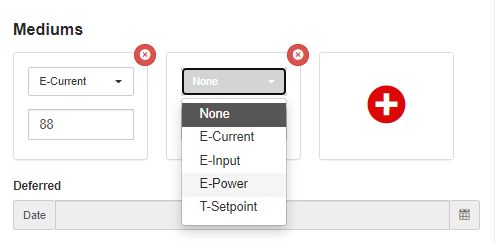
Mediums
Note
To populate the Signal Types drop-down list of the Mediums area, please proceed as follows:
Connect to your i4connected database server, using the Azure Data Studio or Microsoft SQL Server Manager Studio.
Open the Settings table and identify the "measures.energySavingSignalIds" setting.
Here, add the desired Signal Types ID. The Signal Types IDs should be written between square brackets, and separated by a comma.
While in the Settings table, identify the "measures.signalTypeIdNameMapping" setting and define the Signal Type ID and Signal Type name pairs.
The pairs should be listed between square brackets and curly brackets. Each new pair should be separated by a comma.

Please save your changes.
To apply the above settings, please make sure to Restart Internet Information Services (IIS).
After processing the above steps, the Signal Types drop-down list available in the Mediums area will be accordingly populated.
Deferred
Deferral reason
Note
The properties marked with an asterisk (*) are mandatory.