WFTrending2
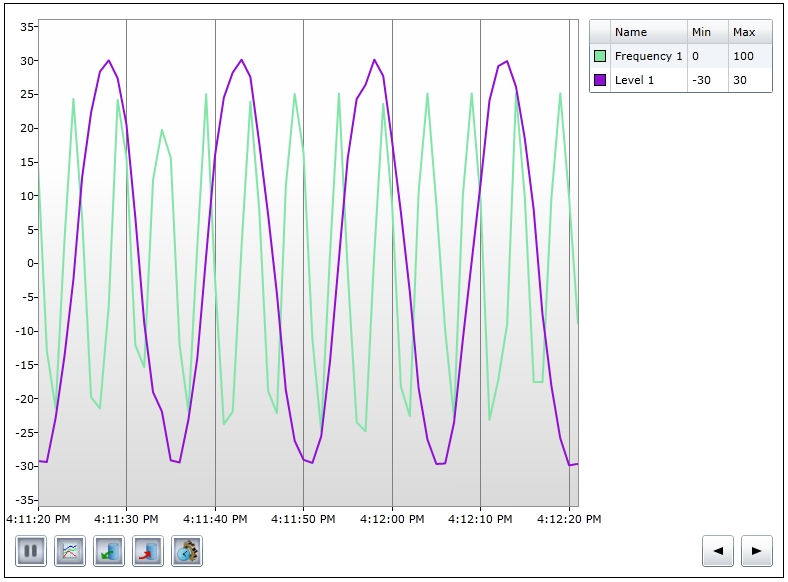
The WFTrending2 control plots the values of one or more signals in a two-dimensional chart. It's provides a limited set of run-time functionality, thus being a simpler version of the powerful WFTrending3 control.
Features
The WFTrending2 control shares the following common features of the Ewon by HMS Networks controls library:
It also provides the following particular features:
Run-time operations tool-bar
The WFTrending2 control allows the user to operate the control using the operations tool-bar:
 Pause/Run - allows the user to pause and resume the chart updates.
 Settings - opens the Change Settings dialog which allows the user to configure the control at run time.
 Load Configuration - loads an existing configuration from the database.
 Save Configuration - saves a configuration to the database.
 Change Time Range - allows the user to change the time range for which the data is displayed.
 Pan left/right - moves the displayed chart area left or right.
Run-time settings
The base functionality of the WFTrending2 control can be adjusted using the Settings button from the option bar. Clicking the Settings button will open the Change Settings window, which contains options to customize the core elements of the WFTrending2 control.
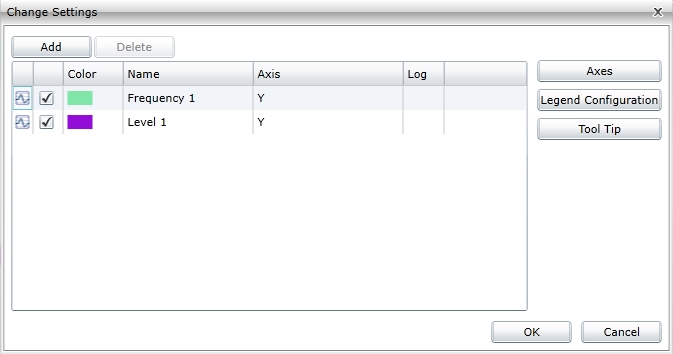
Change Settings window in WFTrending2
Using the Change Settings dialog, the following actions can be achieved at run-time:
Managing the signals
The signal grid lists the signals from the WFTrending2 control as well as their attributes (listed in the grids columns). The available columns are:
Active – contains a check-box button toggling the shown/not shown state of the signal in the WFTrending2 control.
Color – contains a color picker, indicating the color of the trend line, and allows the user to select a pre-defined color, or a custom color.
Name – displays the name of the signal.
Axis – enables the user to select an axis for the signal. Signals can be represented on custom axes, depending on the values or units. The axes can be defined using the Axes button in the Change Settings window.
Log – displays the log name of the selected signal, if the signal has logging. Logging will enable the WFTrending2 control to fetch the data from the database, not from the signal changed event, thus being able to optimize the data acquisition speed and to display historical values.
Above the signals grid, the Add and Delete options are available:
Add – adding one or more signals. Clicking the button will open the signal browser, allowing the user to select and add signals to the WFTrending2 control.
Delete – deletes the selected signals.
The axes setup
Configuring the Axes
The Axes button manages the Y axes on which the signal can be displayed. Clicking the button will open the Axes Configuration dialog.
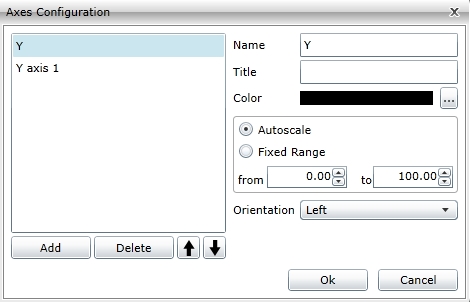
The axes can be added to the graph by clicking the Add button. The axes will be listed in the left side of the window, the right side being used for configuring the selected axes:
Name – the name of the axes. It will be listed in the Axis column drop down box.
Title – the title will be displayed in the WFTrending2 control graph. Each axis can have a representative title.
Color – the color of the axes. Clicking the corresponding button will open the color picker.
Autoscale – if enabled, the axis will modify its values according to the value of the signal/signals tied to this axis.
Fixed range – the axis will have a fixed value representation, using the values specified below (from… to…). If the signal value goes over or below the specified values, the trend line will be cut off the graphic.
Orientation – the axis can be placed either on the left side of the graphic or on the right side of the graphic. If no signal is assigned to a certain axes it will not be drawn on the chart.
The legend configuration
Configuring the Legend
The Legend Configuration allows the user to configure the legend (both analog and digital) of the WFTrending2 control. Clicking on the button will open the Legend Configuration dialog.
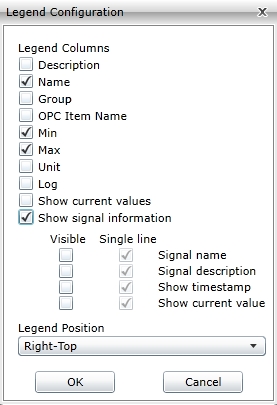
This dialog allows the customization of the legend columns and its position
Description column – displays the description of the signal in the legend.
Name column – displays the name of the signal in the legend.
Group column – displays the signal group in the legend.
OPC Item Name column – displays the OPC item name in the legend.
Min column – displays the minimum value of the signal.
Max column - displays the maximum value of the signal.
Unit column – displays the unit of the signal value.
Log column – displays the logging info of the signal.
Show current values – shows the current value of the signal if no cursor is defined in the trending, or if the cursor is placed before the last updated value. If the cursor is placed in a time range where the charts has data, the current value will be the closest value to the cursor position. This happens for all the trend lines.
Show signal information – shows more signal information, with the ability to put different information on different lines (if more than one information is displayed on the same line, it will be split with the character ‘|’):
Signal name
Signal description
Show timestamp
Show current value
Legend position – allows the user to select the position of the legend in the WFTrending2 control.
The tooltip configuration
Configuring the Tool Tip
Manages the configuration of the tooltip. If clicked, the Cursor Configuration window will open.
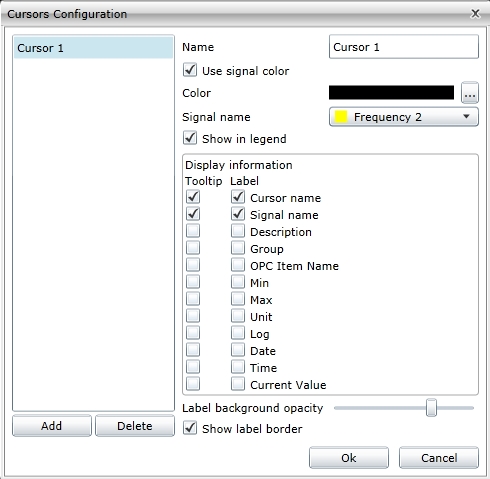
Cursors can be added and deleted using the Add/Delete buttons from the bottom-left side. The main part of the window focuses on cursor customization:
Name – cursor name.
Use signal color – enables the cursor to use the signal color if it is attached to one signal.
Color – allows the user to set a custom color for the cursor.
Signal – allows the user to attach the cursor to a signal.
Show in legend – displays the cursor information in the legend of the WFTrending2 control.
Display information – this table consists in options that can be marked to be displayed either in the tooltip of the cursor, the label of the cursor or both:
Cursor Name – the name of the cursor.
Signal name – the name of the attached signal.
Description – the description of the signal, if available.
Group – the signal group that the attached signal belongs to.
OPC Item Name – the OPC item name of the attached signal.
Min – the minimum value of the attached signal.
Max – the maximum value of the attached signal.
Unit – the unit of measurement of the signal’s value.
Tag – the tag of the signal.
Date – the current date of the signal.
Time – the current timestamp of the signal.
CurrentValue - the current value of the signal if no cursor is defined in the trending, or if the cursor is placed before the last updated value. If the cursor is placed in a time range where the charts has data, the current value will be the closest value to the cursor position. This happens for all the trend lines.
Below the main settings, the Cursors Configuration window displays two graphical settings for the cursors:
Label background opacity – allows the user to set the percentage of opacity of the label.
Show label border – displays a border around the label.
The signal of the cursor can be changed without the need to use the configuration dialog. If a certain cursor is selected and the user clicks on a different signal in the legend, the signal for that cursor will be changed along with its color.
Online mode
The time range button allows the user to switch from the online mode to the historical mode. Historical mode means viewing logged data from the signals. This is why only signals that have logging can be viewed in historical mode.
Clicking on the time range button will open the Range Selection dialog.
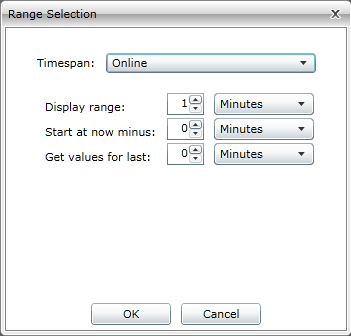
Range Selection dialog
When online, the Range Selection dialog will display the options of viewing online data:
Display range – the time range of the graphic. It can be set to days, hours or minutes.
Start at now minus – sets the starting time of the graphic X minutes/hours/days after the normal start point.
Get values for last – display the historical values for the last X minutes/hours/days and continues with the online data.
Combined, these settings allow the user to see data progress so far and the current data in real time.
Historical mode
When selecting the Timespan option from the Range Selection dialog, the dropdown menu will list the options for displaying historical data.
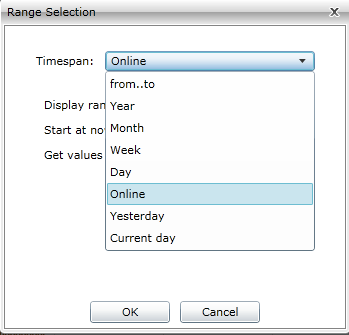
Range Selection expanded
From…to - allows the user to select a time range using exact start and end points. The logged data (historical data) from that period will be displayed in the main graphic.
Year – allows the user to select a specific year to be displayed in the timeline of the main graphic. This option will display the logged (historical) data from the whole year.
Month – allows the user to select a specific month to be displayed in the timeline of the main graphic. This option will display the logged (historical) data from the whole month.
Week – allows the user to select a specific week to be displayed in the timeline of the main graphic. This option will display the logged (historical) data from the whole week.
Day – allows the user to select a specific day to be displayed in the timeline of the main graphic. This option will display the logged (historical) data from the whole day.
Online – the online mode.
Yesterday – displays the data from the day before the current day.
Current day – displays the data from the current day, up to the point representing the current time of selection.
Save/load configuration
Loading and saving a configuration is done using the load and save buttons from the options bar.
The configurations are written to the database, and loaded from there back. The name of the configuration is case sensitive. If the name of the configuration already exists, the new save will overwrite the old one.
If a Namespace is set in the WFTrending2 control at design time, only the configurations belonging to that namespace will be available to load from the database. Thus, a configuration is uniquely defined by its name and/or namespace.
Design-time initial configuration settings
The WFTrending2 control allows the user to setup an initial configuration that will be loaded when the applications starts. The initial configuration is saved in the database, and requires a configuration namespace to which the configuration belongs.
Online and offline workflow
Online workflow diagram
The diagram below explains the WFTrending2 workflow when plotting online signal values.
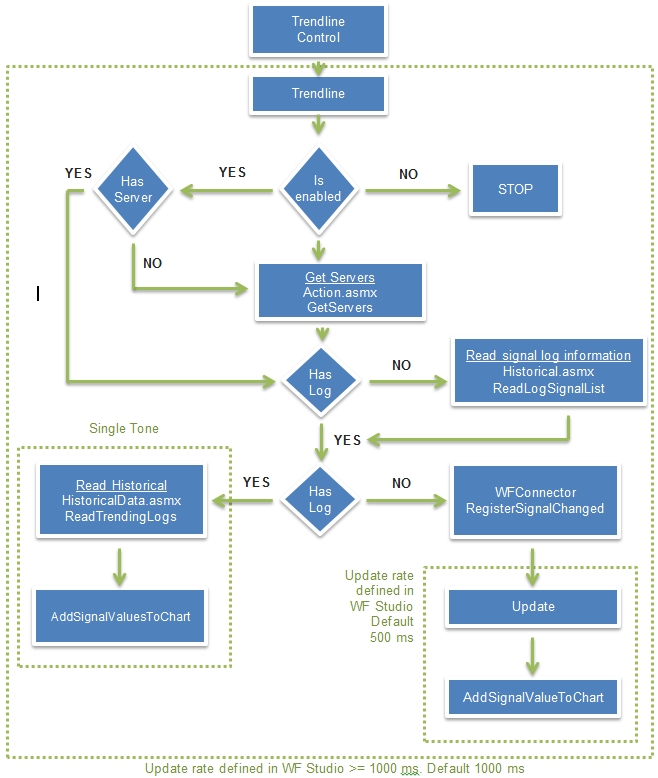
Online state visual representation
For each trendline, the WFTrending2 control checks to see if it is enabled. If not enabled, the process stops.
If the trendline is enabled, the servers are checked. If there are no servers, the GetServers method from Action.asmx webservice is called. This method retrieves the information about all the signals form the server.
When servers available, the log of the signal is checked. If the signal has no log, ReadLogSignalList method from Historical.asmx webservice is called. The ReadLogSignalList method returns the information for the verified signal.
The signal is checked for logging information again. If after ReadLogSignalList the signal has logging information, the ReadTrendingLogs method from the HistoricalData.asmx webservice is called. This method returns the trend data from the logs. The AddSignalValuesToChart method is called to write the historical values to the WFTrending2 control graphic.
If no logging information is retrieved after calling the ReadLogSignalList, the RegisterSignalChanged method from WFConnector is called. This method checks the value of the signal and updates it asynchronously. Again, the AddSignalValueToChart method is called, to write the online values retrieved by the WFConnector.
Offline workflow diagram
The diagram below explains the WFTrending2 workflow when plotting offline signal values.
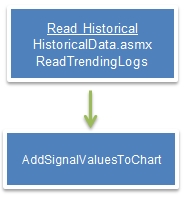
Offline state visual representation
For each trendline, the ReadTrendingLogs method from HistoricalData.asmx is called, retrieving the historical data for the signal. The AddSignalValuesToChart method is called to write the values to the WFTrending2 control.
Design-time properties
The WFTrending2 control shares the following common design-time properties of the Ewon by HMS Networks controls library:
It also exposes the following particular properties in 's Property Inspector:
Configuration properties
In Microsoft Blend and Visual Studio, the following properties can be found under the WEBfactory 2010 - Dialog and WEBfactory 2010 Silverlight Controls categories.
ClientSideConfiguration – if set to on, the configuration will be stored on the local machine’s Isolated Storage. The loading of the configuration will be made from the local Isolated Storage.
ConfigurationNamespace – the namespace of the configuration. A configuration is defined by a name and a namespace. The combination of name and namespace must be unique. If a namespace is defined in this option, the WFTrending2 control will only be able to see the configurations that belong to this namespace, when loading them from the database.
InitialConfiguration – the name of the configuration to be loaded by default. By declaring the namespace of the configuration (in the previous option) and the name of the configuration in the InitialConfiguration text field, the WFTrending2 control will load by default the specified configuration from the database.
PopupModality – this settings allows the user to choose the modality for the popup windows displayed by the WFTrending2 control at runtime. The user can choose between modal and modeless.
TimeZone – allows the user to choose the time zone for the WFTrending2 control at runtime. The options are:
ClientTime – the time zone of the machine where the visualization is running.
ServerTime – the time zone of the machine on which Ewon by HMS Networks Server is running.
UTCTime – the UTC time zone.