WFChart1
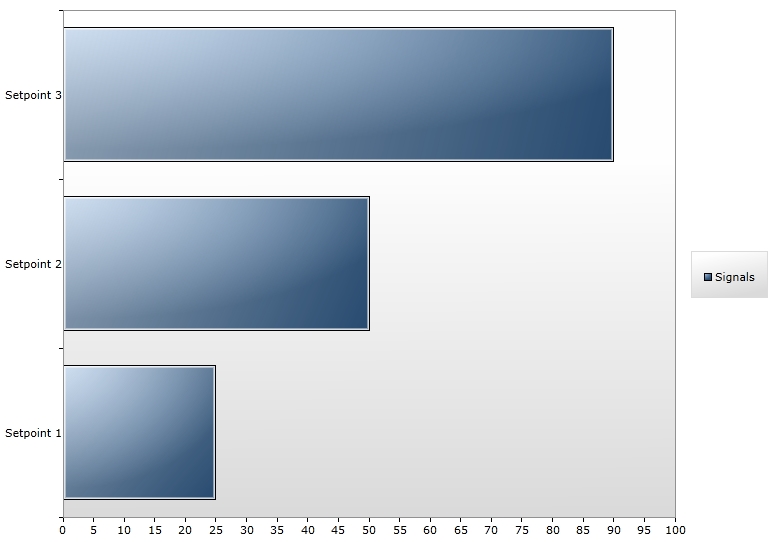
The WFChart1 control is a simple chart control that plots the values of the selected signals in a value-scaled chart. The data can be displayed as either bars, columns lines or as pie chart.
Features
The WFChart1 control shares the following common features of the Ewon by HMS Networks controls library:
Design-time properties
The WFChart1 control shares some of the following common design-time properties of the Ewon by HMS Networks controls library:
It also exposes the following particular properties in 's Property Inspector:
Configuration properties
In Microsoft Blend and Visual Studio, the following properties can be found under the WEBfactory 2010 - General category.
ChartType – allows the user to select the type of chart used to display the signal values. The available options are:
Bar
Column
Line
Pie
Interval - defines the marked intervals on the horizontal value axis.
Maximum - defines the maximum value to be represented on the horizontal value axis.
Minimum - defines the minimum value to be represented on the horizontal value axis.
Signals properties
In Microsoft Blend and Visual Studio, the following properties can be found under the WEBfactory 2010 - Signals category.
SignalsDescriptions - the description of the signals which will be displayed as labels on the left side of the chart.
SignalsNames - the names of the signals that will be used by this control for displaying and/or writing values. This control supports multiple signal names that must be typed manually into the property text field.