WFAlarmFrequency1
The WFAlarmFrequency1 control provides comprehensive statistics on alarms frequency. The control can be set up to display alarm frequency statistics for specific alarm groups and types and in a confined time frame.
Visual Structure
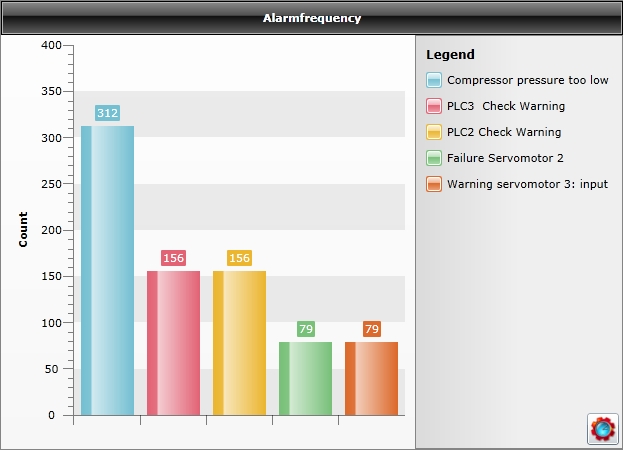
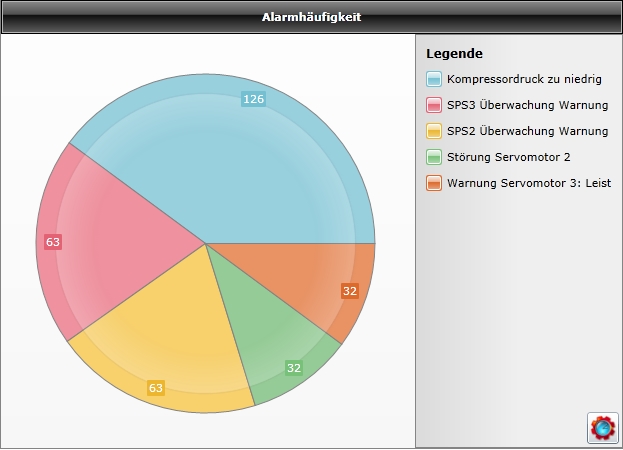
The WFAlarmFrequency1 control uses columns and pie chart types to display the frequency of selected alarms over a defined time span. The monitored alarms are also available in the control's legend.
Run-time Features
The WFAlarmFrequency1 control allows the user to select the time span for which the statistics are displayed, using a modal/modeless pop-up window at design time. The user has the ability to select one of the following options for the time span setting:
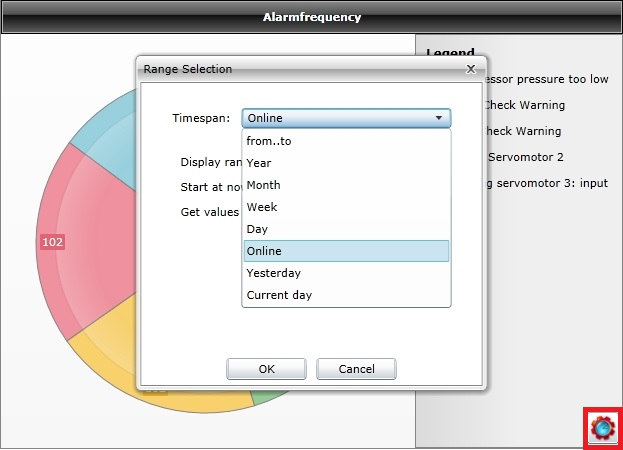
From…to - allows the user to select a time range using exact start and end points. The alarm frequency statistics from that period will be displayed.
Year – allows the user to select a specific year. The alarm frequency statistics from the whole selected year will be displayed.
Month – allows the user to select a specific month. The alarm frequency statistics from the whole selected month will be displayed.
Week – allows the user to select a specific week. The alarm frequency statistics from the whole selected week will be displayed.
Day – allows the user to select a specific day. The alarm frequency statistics from the whole selected day will be displayed.
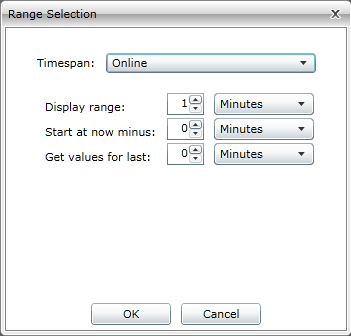
Online – the online mode. When online, the Range Selection dialog will display the options of viewing online data:
Display range – the time range of the graphic. It can be set to days, hours or minutes.
Start at now minus – sets the starting time X minutes/hours/days after the normal start point.
Get values for last – display the alarm frequency statistics for the last X minutes/hours/days and continues with the online data.
Yesterday – displays the alarm frequency statistics from the day before the current day.
Current day – displays the alarm frequency statistics from the current day, up to the point representing the current time of selection.
Design-time Features
At design time, the WFAlarmFrequency1 control exposes the following functionality:
Allows the user to configure the alarm group, type and the maximum number of alarms to be analyzed and displayed.
Several chart themes options, allowing the user to customize the appearance of the control.
The option to confine the time span from which the statistics are pulled.
WEBfactory 2010 security features, allowing the user to make the control available only to certain users or user groups.
Follow the Related Topics link from the bottom of this page to see the WFAlarmFrequency1 control and its properties at design time.
Design-time Properties
The control's design time properties are available in the Properties panel:
AlarmGroupName - the alarm group from which the alarms frequency statistics will be displayed. If left blank, the control will display statistics for all the alarms.
AlarmTypeName - the alarm type from which the alarms frequency statistics will be displayed. If left blank, the control will display statistics for all the alarms.
ChartTheme - the theme of the chart displaying the alarms frequency statistics. It can be: OfficeBlack, OfficeBlue, OfficeSilverli, Summer, Vista and Windows7.
RefreshInterval - the time interval, expressed in seconds, from one refresh to the next. The refresh is automatic.
SecurityAuthorizationName - allows the user to select an authorization group. The members of the selected authorization group will have access to the control.
SecurityDenyAccessBehaviour - allows the user to select a behavior that will be active when a user that doesn't belong to the above selected authorization group logs in. The behavior can be either disabled or hidden.
DisplayType - the type of diagram in which the statistics will be displayed. Can be Column or Pie.
StartDate - the start date of the time period for which the statistics will be displayed. If the time period is set through the StartDate and EndDate properties, the DefaultRange will be ignored.
EndDate - the end date of the time period for which the statistics will be displayed. If the time period is set through the StartDate and EndDate properties, the DefaultRange will be ignored.
DefaultRange - the default time span for which the alarms frequency statistics will be displayed. Can be: CurrentDay, LastWeek or LastMonth. If the time period is set through the StartDate and EndDate properties, the DefaultRange will be ignored.
MaximumAlarms - the maximum number of alarms for which the statistics will be displayed.
PopupModality - the popup modality of the Range Selection window. Can be Modal or Modeless.