Charts
Check out this article and learn all that you need to know about the WEBfactory 2010 SmartEditor Charts controls.
The charts category contains three controls designed to represent live and historical data in multi-axis chart plots. The signal lines are defined by the two axis, one representing the signal value and the other the time or reading the value. The chart controls provide additional signal information in the form of legends. The signals representation is not limited to a decimal scale, but can be adjusted to represent the values on both scientific and logarithmic scales.
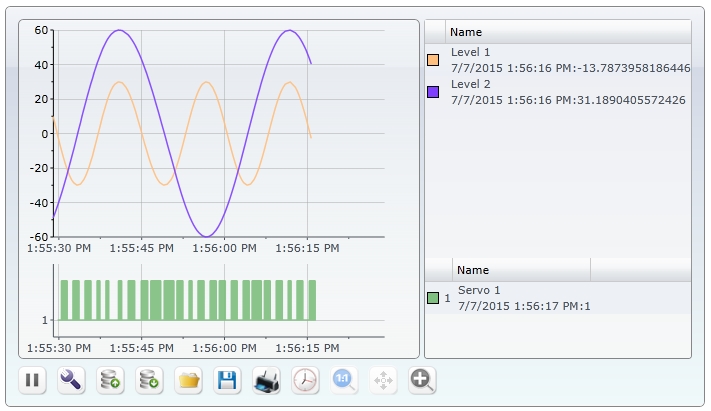
The WEBfactory 2010 controls library provides three chart controls: WFTrending3, WFTrending2 and WFChart1. The latter, WFTrending3 provides the most complex functionality, including multiple axis representation, various scales and even binary plots.
Click on controls names from the table below to view their particular features and properties:
Name | Description | Screenshot |
|---|---|---|
WFTrending3 control displays data in a multi-axes graphic environment, using colored shapes for accurate data representation. It can represent both live and historical data and can use decimal, scientific and logarithmic value scales. |  | |
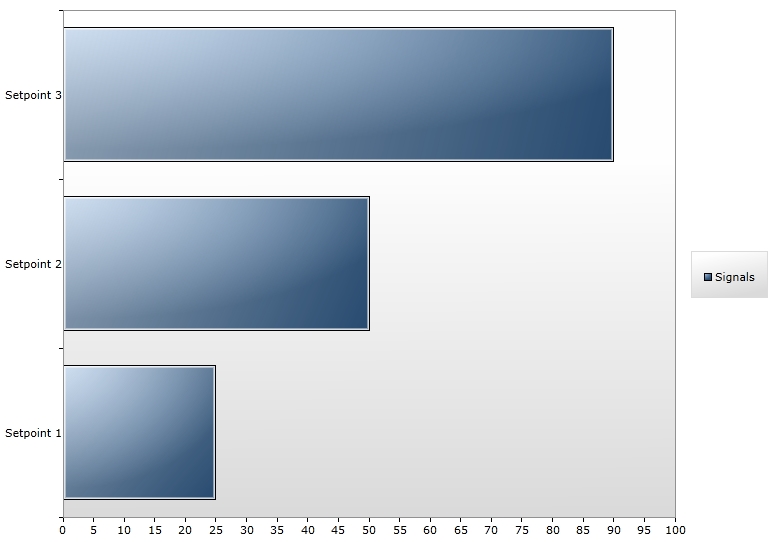
The WFChart1 control is a simple chart control that plots the values of the selected signals in a value-scaled chart. The data can be displayed as either bars, columns lines or as pie chart. |  | |
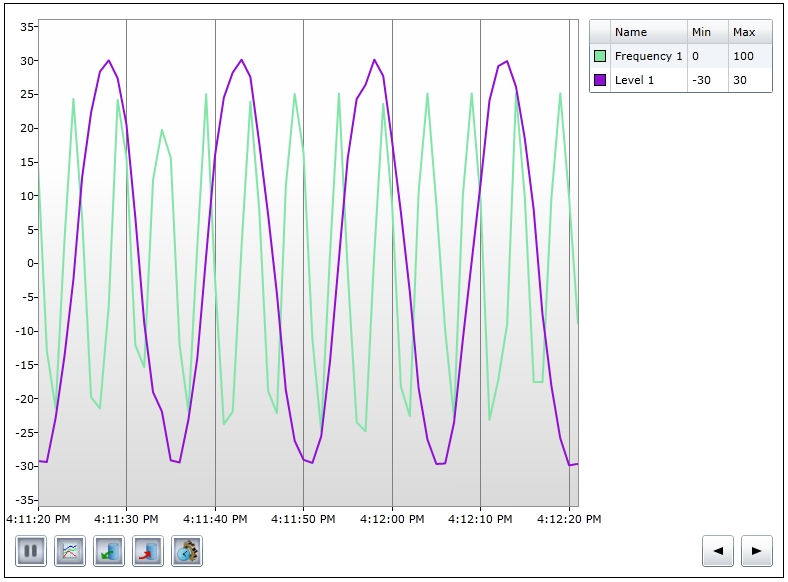
The WFTrending2 control plots the values of one or more signals in a two-dimensional chart. It's provides a limited set of run-time functionality, thus being a simpler version of the powerful WFTrending3 control. |  |